Thai vs Immigrants from Congo 6th Grade
COMPARE
Thai
Immigrants from Congo
6th Grade
6th Grade Comparison
Thais
Immigrants from Congo
97.4%
6TH GRADE
96.9/ 100
METRIC RATING
110th/ 347
METRIC RANK
96.5%
6TH GRADE
0.6/ 100
METRIC RATING
255th/ 347
METRIC RANK
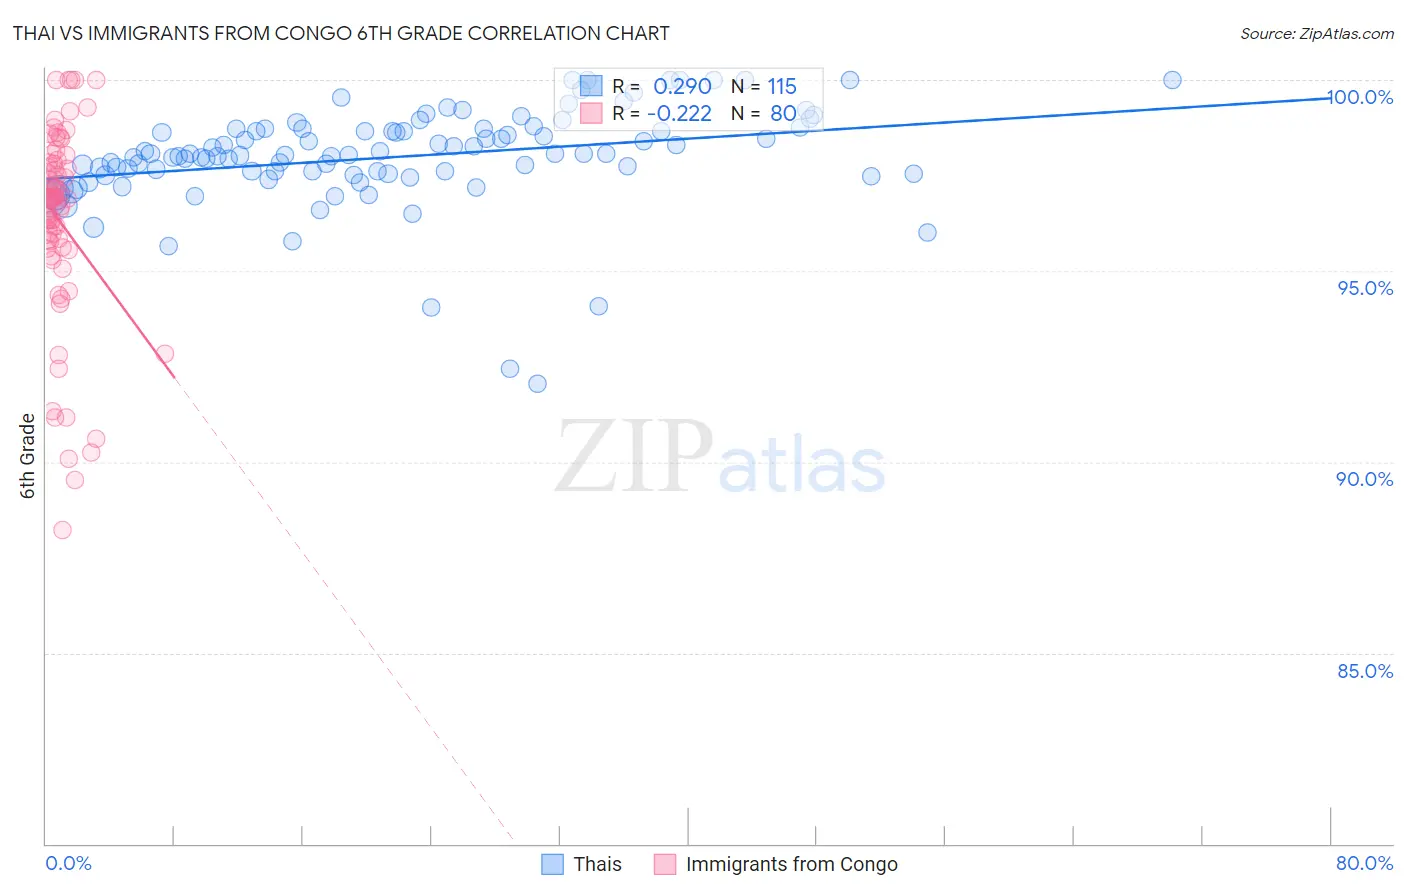
Thai vs Immigrants from Congo 6th Grade Correlation Chart
The statistical analysis conducted on geographies consisting of 475,866,115 people shows a weak positive correlation between the proportion of Thais and percentage of population with at least 6th grade education in the United States with a correlation coefficient (R) of 0.290 and weighted average of 97.4%. Similarly, the statistical analysis conducted on geographies consisting of 92,124,753 people shows a weak negative correlation between the proportion of Immigrants from Congo and percentage of population with at least 6th grade education in the United States with a correlation coefficient (R) of -0.222 and weighted average of 96.5%, a difference of 0.99%.
6th Grade Correlation Summary
| Measurement | Thai | Immigrants from Congo |
| Minimum | 92.1% | 88.2% |
| Maximum | 100.0% | 100.0% |
| Range | 7.9% | 11.8% |
| Mean | 98.0% | 96.3% |
| Median | 98.0% | 96.9% |
| Interquartile 25% (IQ1) | 97.5% | 95.6% |
| Interquartile 75% (IQ3) | 98.7% | 97.8% |
| Interquartile Range (IQR) | 1.2% | 2.2% |
| Standard Deviation (Sample) | 1.3% | 2.6% |
| Standard Deviation (Population) | 1.3% | 2.6% |
Similar Demographics by 6th Grade
Demographics Similar to Thais by 6th Grade
In terms of 6th grade, the demographic groups most similar to Thais are Iroquois (97.4%, a difference of 0.0%), Immigrants from Latvia (97.4%, a difference of 0.010%), Nonimmigrants (97.4%, a difference of 0.020%), Immigrants from Czechoslovakia (97.4%, a difference of 0.020%), and Immigrants from Saudi Arabia (97.4%, a difference of 0.020%).
| Demographics | Rating | Rank | 6th Grade |
| Bhutanese | 98.0 /100 | #103 | Exceptional 97.5% |
| German Russians | 97.9 /100 | #104 | Exceptional 97.5% |
| Cheyenne | 97.9 /100 | #105 | Exceptional 97.5% |
| Menominee | 97.7 /100 | #106 | Exceptional 97.5% |
| Immigrants | Singapore | 97.6 /100 | #107 | Exceptional 97.5% |
| Immigrants | Nonimmigrants | 97.3 /100 | #108 | Exceptional 97.4% |
| Immigrants | Czechoslovakia | 97.3 /100 | #109 | Exceptional 97.4% |
| Thais | 96.9 /100 | #110 | Exceptional 97.4% |
| Iroquois | 96.9 /100 | #111 | Exceptional 97.4% |
| Immigrants | Latvia | 96.7 /100 | #112 | Exceptional 97.4% |
| Immigrants | Saudi Arabia | 96.5 /100 | #113 | Exceptional 97.4% |
| Colville | 96.4 /100 | #114 | Exceptional 97.4% |
| Immigrants | Switzerland | 95.7 /100 | #115 | Exceptional 97.4% |
| Lebanese | 95.5 /100 | #116 | Exceptional 97.4% |
| Basques | 95.4 /100 | #117 | Exceptional 97.4% |
Demographics Similar to Immigrants from Congo by 6th Grade
In terms of 6th grade, the demographic groups most similar to Immigrants from Congo are Immigrants from Ethiopia (96.5%, a difference of 0.0%), Immigrants from Uruguay (96.5%, a difference of 0.010%), Jamaican (96.5%, a difference of 0.010%), U.S. Virgin Islander (96.5%, a difference of 0.010%), and Immigrants from Senegal (96.5%, a difference of 0.020%).
| Demographics | Rating | Rank | 6th Grade |
| Tohono O'odham | 1.0 /100 | #248 | Tragic 96.5% |
| Colombians | 0.9 /100 | #249 | Tragic 96.5% |
| Immigrants | Middle Africa | 0.8 /100 | #250 | Tragic 96.5% |
| Immigrants | Senegal | 0.7 /100 | #251 | Tragic 96.5% |
| Immigrants | Uruguay | 0.6 /100 | #252 | Tragic 96.5% |
| Jamaicans | 0.6 /100 | #253 | Tragic 96.5% |
| Immigrants | Ethiopia | 0.6 /100 | #254 | Tragic 96.5% |
| Immigrants | Congo | 0.6 /100 | #255 | Tragic 96.5% |
| U.S. Virgin Islanders | 0.5 /100 | #256 | Tragic 96.5% |
| Taiwanese | 0.5 /100 | #257 | Tragic 96.5% |
| Immigrants | China | 0.4 /100 | #258 | Tragic 96.4% |
| South Americans | 0.4 /100 | #259 | Tragic 96.4% |
| Peruvians | 0.4 /100 | #260 | Tragic 96.4% |
| Immigrants | Sierra Leone | 0.4 /100 | #261 | Tragic 96.4% |
| Immigrants | Nigeria | 0.3 /100 | #262 | Tragic 96.4% |