Immigrants from Liberia vs Immigrants from Scotland 3rd Grade
COMPARE
Immigrants from Liberia
Immigrants from Scotland
3rd Grade
3rd Grade Comparison
Immigrants from Liberia
Immigrants from Scotland
97.3%
3RD GRADE
0.5/ 100
METRIC RATING
258th/ 347
METRIC RANK
98.3%
3RD GRADE
99.8/ 100
METRIC RATING
53rd/ 347
METRIC RANK
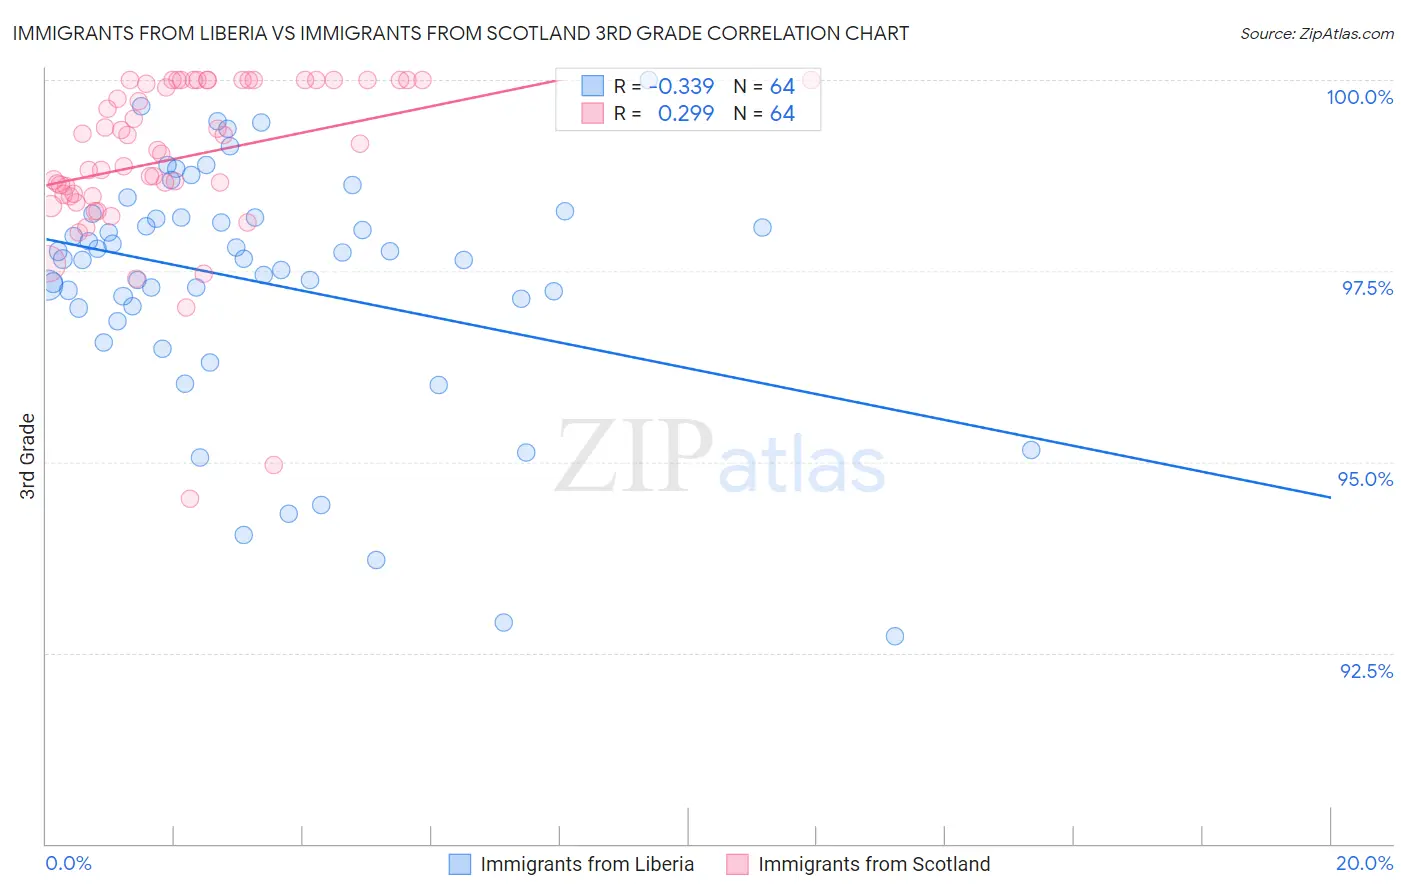
Immigrants from Liberia vs Immigrants from Scotland 3rd Grade Correlation Chart
The statistical analysis conducted on geographies consisting of 135,294,272 people shows a mild negative correlation between the proportion of Immigrants from Liberia and percentage of population with at least 3rd grade education in the United States with a correlation coefficient (R) of -0.339 and weighted average of 97.3%. Similarly, the statistical analysis conducted on geographies consisting of 196,398,887 people shows a weak positive correlation between the proportion of Immigrants from Scotland and percentage of population with at least 3rd grade education in the United States with a correlation coefficient (R) of 0.299 and weighted average of 98.3%, a difference of 0.98%.
3rd Grade Correlation Summary
| Measurement | Immigrants from Liberia | Immigrants from Scotland |
| Minimum | 92.7% | 94.5% |
| Maximum | 100.0% | 100.0% |
| Range | 7.3% | 5.5% |
| Mean | 97.3% | 99.0% |
| Median | 97.7% | 99.1% |
| Interquartile 25% (IQ1) | 97.0% | 98.5% |
| Interquartile 75% (IQ3) | 98.2% | 100.0% |
| Interquartile Range (IQR) | 1.2% | 1.5% |
| Standard Deviation (Sample) | 1.6% | 1.1% |
| Standard Deviation (Population) | 1.6% | 1.1% |
Similar Demographics by 3rd Grade
Demographics Similar to Immigrants from Liberia by 3rd Grade
In terms of 3rd grade, the demographic groups most similar to Immigrants from Liberia are Immigrants from Colombia (97.3%, a difference of 0.010%), Armenian (97.3%, a difference of 0.010%), Immigrants from Ethiopia (97.3%, a difference of 0.010%), Bolivian (97.3%, a difference of 0.020%), and Immigrants from Congo (97.3%, a difference of 0.020%).
| Demographics | Rating | Rank | 3rd Grade |
| Immigrants | Asia | 0.8 /100 | #251 | Tragic 97.4% |
| Peruvians | 0.8 /100 | #252 | Tragic 97.4% |
| Immigrants | Africa | 0.8 /100 | #253 | Tragic 97.4% |
| Jamaicans | 0.7 /100 | #254 | Tragic 97.4% |
| Bolivians | 0.6 /100 | #255 | Tragic 97.3% |
| Immigrants | Congo | 0.6 /100 | #256 | Tragic 97.3% |
| Immigrants | Colombia | 0.5 /100 | #257 | Tragic 97.3% |
| Immigrants | Liberia | 0.5 /100 | #258 | Tragic 97.3% |
| Armenians | 0.4 /100 | #259 | Tragic 97.3% |
| Immigrants | Ethiopia | 0.4 /100 | #260 | Tragic 97.3% |
| Immigrants | South America | 0.4 /100 | #261 | Tragic 97.3% |
| Immigrants | Sierra Leone | 0.4 /100 | #262 | Tragic 97.3% |
| Taiwanese | 0.3 /100 | #263 | Tragic 97.3% |
| West Indians | 0.3 /100 | #264 | Tragic 97.3% |
| Immigrants | Jamaica | 0.3 /100 | #265 | Tragic 97.3% |
Demographics Similar to Immigrants from Scotland by 3rd Grade
In terms of 3rd grade, the demographic groups most similar to Immigrants from Scotland are Estonian (98.3%, a difference of 0.010%), Celtic (98.3%, a difference of 0.010%), Australian (98.3%, a difference of 0.010%), White/Caucasian (98.3%, a difference of 0.010%), and Bulgarian (98.3%, a difference of 0.010%).
| Demographics | Rating | Rank | 3rd Grade |
| Ottawa | 99.8 /100 | #46 | Exceptional 98.3% |
| Czechoslovakians | 99.8 /100 | #47 | Exceptional 98.3% |
| Lumbee | 99.8 /100 | #48 | Exceptional 98.3% |
| Estonians | 99.8 /100 | #49 | Exceptional 98.3% |
| Celtics | 99.8 /100 | #50 | Exceptional 98.3% |
| Australians | 99.8 /100 | #51 | Exceptional 98.3% |
| Whites/Caucasians | 99.8 /100 | #52 | Exceptional 98.3% |
| Immigrants | Scotland | 99.8 /100 | #53 | Exceptional 98.3% |
| Bulgarians | 99.8 /100 | #54 | Exceptional 98.3% |
| Americans | 99.8 /100 | #55 | Exceptional 98.3% |
| Austrians | 99.8 /100 | #56 | Exceptional 98.3% |
| Slavs | 99.7 /100 | #57 | Exceptional 98.3% |
| Greeks | 99.7 /100 | #58 | Exceptional 98.3% |
| Maltese | 99.7 /100 | #59 | Exceptional 98.3% |
| Creek | 99.7 /100 | #60 | Exceptional 98.2% |