Immigrants from Asia vs Immigrants from Costa Rica 11th Grade
COMPARE
Immigrants from Asia
Immigrants from Costa Rica
11th Grade
11th Grade Comparison
Immigrants from Asia
Immigrants from Costa Rica
92.4%
11TH GRADE
37.4/ 100
METRIC RATING
184th/ 347
METRIC RANK
91.4%
11TH GRADE
0.9/ 100
METRIC RATING
251st/ 347
METRIC RANK
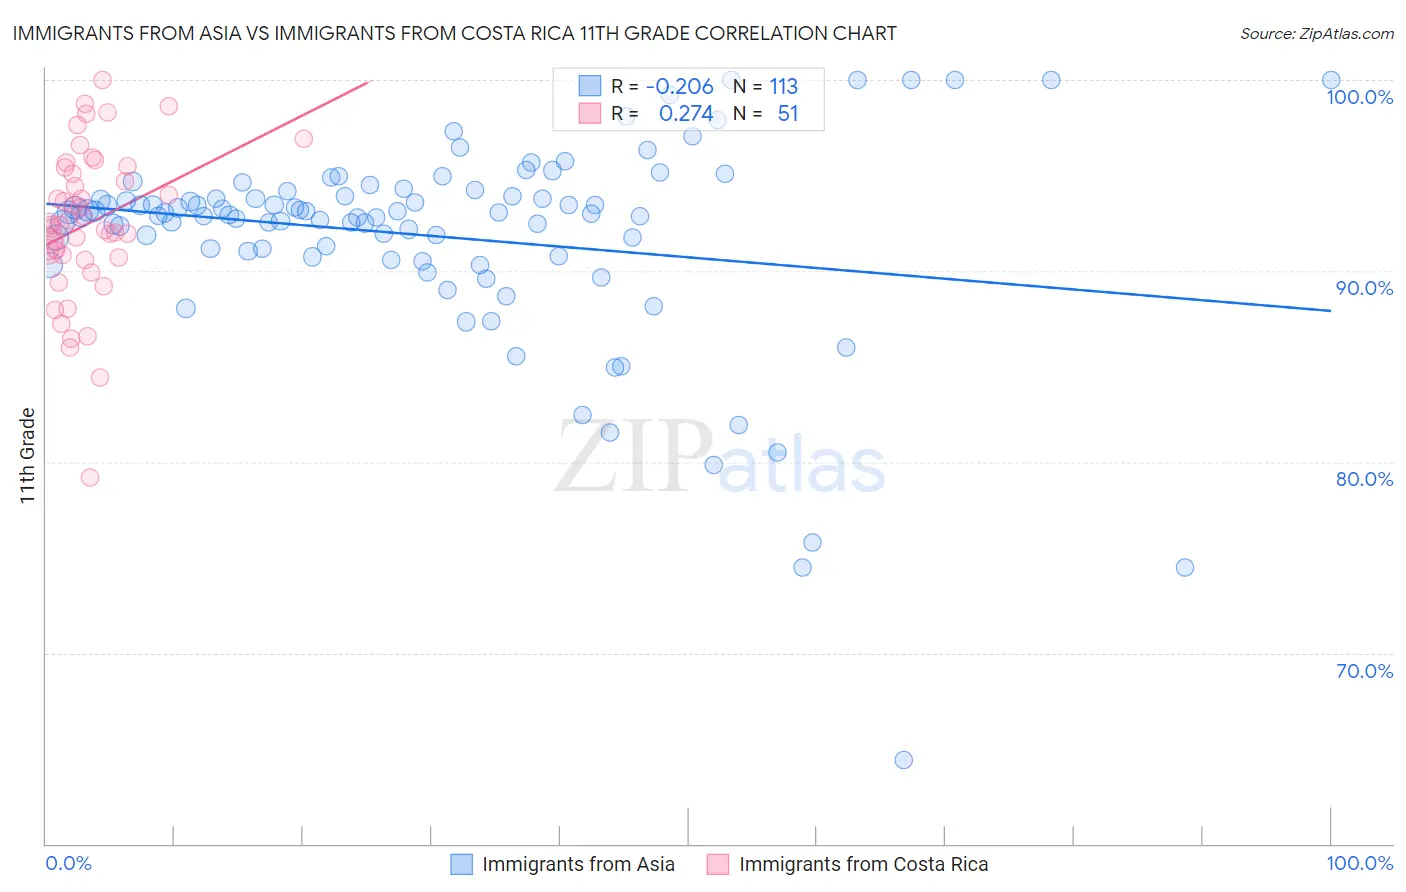
Immigrants from Asia vs Immigrants from Costa Rica 11th Grade Correlation Chart
The statistical analysis conducted on geographies consisting of 549,170,438 people shows a weak negative correlation between the proportion of Immigrants from Asia and percentage of population with at least 11th grade education in the United States with a correlation coefficient (R) of -0.206 and weighted average of 92.4%. Similarly, the statistical analysis conducted on geographies consisting of 204,277,241 people shows a weak positive correlation between the proportion of Immigrants from Costa Rica and percentage of population with at least 11th grade education in the United States with a correlation coefficient (R) of 0.274 and weighted average of 91.4%, a difference of 1.1%.
11th Grade Correlation Summary
| Measurement | Immigrants from Asia | Immigrants from Costa Rica |
| Minimum | 64.4% | 79.2% |
| Maximum | 100.0% | 100.0% |
| Range | 35.6% | 20.8% |
| Mean | 91.8% | 92.5% |
| Median | 93.0% | 92.4% |
| Interquartile 25% (IQ1) | 90.9% | 90.7% |
| Interquartile 75% (IQ3) | 94.1% | 95.4% |
| Interquartile Range (IQR) | 3.1% | 4.7% |
| Standard Deviation (Sample) | 5.4% | 4.0% |
| Standard Deviation (Population) | 5.4% | 4.0% |
Similar Demographics by 11th Grade
Demographics Similar to Immigrants from Asia by 11th Grade
In terms of 11th grade, the demographic groups most similar to Immigrants from Asia are Immigrants from Malaysia (92.4%, a difference of 0.0%), Immigrants from Morocco (92.4%, a difference of 0.010%), Immigrants from Nepal (92.4%, a difference of 0.010%), Arapaho (92.4%, a difference of 0.020%), and Inupiat (92.4%, a difference of 0.030%).
| Demographics | Rating | Rank | 11th Grade |
| Guamanians/Chamorros | 45.0 /100 | #177 | Average 92.5% |
| Sudanese | 43.4 /100 | #178 | Average 92.5% |
| Creek | 40.9 /100 | #179 | Average 92.4% |
| Inupiat | 40.7 /100 | #180 | Average 92.4% |
| Cherokee | 40.7 /100 | #181 | Average 92.4% |
| Immigrants | Morocco | 38.6 /100 | #182 | Fair 92.4% |
| Immigrants | Malaysia | 37.6 /100 | #183 | Fair 92.4% |
| Immigrants | Asia | 37.4 /100 | #184 | Fair 92.4% |
| Immigrants | Nepal | 36.4 /100 | #185 | Fair 92.4% |
| Arapaho | 35.1 /100 | #186 | Fair 92.4% |
| Immigrants | Western Asia | 35.0 /100 | #187 | Fair 92.4% |
| Immigrants | Indonesia | 33.7 /100 | #188 | Fair 92.4% |
| Immigrants | Chile | 33.3 /100 | #189 | Fair 92.4% |
| Chickasaw | 31.4 /100 | #190 | Fair 92.3% |
| French American Indians | 30.8 /100 | #191 | Fair 92.3% |
Demographics Similar to Immigrants from Costa Rica by 11th Grade
In terms of 11th grade, the demographic groups most similar to Immigrants from Costa Rica are Immigrants from Nigeria (91.4%, a difference of 0.010%), Peruvian (91.5%, a difference of 0.020%), Ghanaian (91.5%, a difference of 0.020%), Immigrants from South America (91.4%, a difference of 0.020%), and Immigrants from Philippines (91.5%, a difference of 0.030%).
| Demographics | Rating | Rank | 11th Grade |
| Senegalese | 1.4 /100 | #244 | Tragic 91.6% |
| Africans | 1.3 /100 | #245 | Tragic 91.5% |
| Seminole | 1.2 /100 | #246 | Tragic 91.5% |
| Immigrants | Philippines | 1.0 /100 | #247 | Tragic 91.5% |
| Immigrants | Uzbekistan | 1.0 /100 | #248 | Tragic 91.5% |
| Peruvians | 1.0 /100 | #249 | Tragic 91.5% |
| Ghanaians | 0.9 /100 | #250 | Tragic 91.5% |
| Immigrants | Costa Rica | 0.9 /100 | #251 | Tragic 91.4% |
| Immigrants | Nigeria | 0.8 /100 | #252 | Tragic 91.4% |
| Immigrants | South America | 0.8 /100 | #253 | Tragic 91.4% |
| Immigrants | Eritrea | 0.7 /100 | #254 | Tragic 91.4% |
| Blacks/African Americans | 0.7 /100 | #255 | Tragic 91.4% |
| Immigrants | Senegal | 0.7 /100 | #256 | Tragic 91.4% |
| Cajuns | 0.7 /100 | #257 | Tragic 91.4% |
| Immigrants | Colombia | 0.6 /100 | #258 | Tragic 91.4% |