Taiwanese vs Immigrants College, 1 year or more

COMPARE

Taiwanese
Race
Ancestry
AfghanAfricanAlaska NativeAlaskan AthabascanAlbanianAleutAlsatianAmericanApacheArabArapahoArgentineanArmenianAssyrian/Chaldean/SyriacAustralianAustrianBahamianBangladeshiBarbadianBasqueBelgianBelizeanBermudanBhutaneseBlackfeetBolivianBrazilianBritishBritish West IndianBulgarianBurmeseCajunCambodianCanadianCape VerdeanCarpatho RusynCelticCentral AmericanCentral American IndianCherokeeCheyenneChickasawChileanChineseChippewaChoctawColombianColvilleComancheCosta RicanCreeCreekCroatianCrowCubanCypriotCzechCzechoslovakianDanishDelawareDominicanDutchDutch West IndianEastern EuropeanEcuadorianEgyptianEnglishEstonianEthiopianEuropeanFijianFilipinoFinnishFrenchFrench American IndianFrench CanadianGermanGerman RussianGhanaianGreekGuamanian/ChamorroGuatemalanGuyaneseHaitianHmongHonduranHopiHoumaHungarianIcelanderIndian (Asian)IndonesianInupiatIranianIraqiIrishIroquoisIsraeliItalianJamaicanJapaneseJordanianKenyanKiowaKoreanLaotianLatvianLebaneseLiberianLithuanianLumbeeLuxembourgerMacedonianMalaysianMalteseMarshalleseMenomineeMexicanMexican American IndianMongolianMoroccanNative HawaiianNavajoNepaleseNew ZealanderNicaraguanNigerianNorthern EuropeanNorwegianOkinawanOsageOttawaPaiutePakistaniPalestinianPanamanianParaguayanPennsylvania GermanPeruvianPimaPolishPortuguesePotawatomiPuebloPuerto RicanPuget Sound SalishRomanianRussianSalvadoranSamoanScandinavianScotch-IrishScottishSeminoleSenegaleseSerbianShoshoneSierra LeoneanSiouxSlavicSlovakSloveneSomaliSouth AfricanSouth AmericanSouth American IndianSoviet UnionSpaniardSpanishSpanish AmericanSpanish American IndianSri LankanSubsaharan AfricanSudaneseSwedishSwissSyrianTaiwaneseThaiTlingit-HaidaTohono O'OdhamTonganTrinidadian and TobagonianTsimshianTurkishU.S. Virgin IslanderUgandanUkrainianUruguayanUteVenezuelanVietnameseWelshWest IndianYakamaYaquiYugoslavianYumanYup'ikZimbabwean
Immigration
NonimmigrantsAfghanistanAfricaAlbaniaArgentinaArmeniaAsiaAustraliaAustriaBahamasBangladeshBarbadosBelarusBelgiumBelizeBoliviaBosnia and HerzegovinaBrazilBulgariaBurma/MyanmarCabo VerdeCambodiaCameroonCanadaCaribbeanCentral AmericaChileChinaColombiaCongoCosta RicaCroatiaCubaCzechoslovakiaDenmarkDominicaDominican RepublicEastern AfricaEastern AsiaEastern EuropeEcuadorEgyptEl SalvadorEnglandEritreaEthiopiaEuropeFijiFranceGermanyGhanaGreeceGrenadaGuatemalaGuyanaHaitiHondurasHong KongHungaryIndiaIndonesiaIranIraqIrelandIsraelItalyJamaicaJapanJordanKazakhstanKenyaKoreaKuwaitLaosLatin AmericaLatviaLebanonLiberiaLithuaniaMalaysiaMexicoMicronesiaMiddle AfricaMoldovaMoroccoNepalNetherlandsNicaraguaNigeriaNorth AmericaNorth MacedoniaNorthern AfricaNorthern EuropeNorwayOceaniaPakistanPanamaPeruPhilippinesPolandPortugalRomaniaRussiaSaudi ArabiaScotlandSenegalSerbiaSierra LeoneSingaporeSomaliaSouth AfricaSouth AmericaSouth Central AsiaSouth Eastern AsiaSouthern EuropeSpainSri LankaSt. Vincent and the GrenadinesSudanSwedenSwitzerlandSyriaTaiwanThailandTrinidad and TobagoTurkeyUgandaUkraineUruguayUzbekistanVenezuelaVietnamWest IndiesWestern AfricaWestern AsiaWestern EuropeYemenZaireZimbabweAzores
Immigrants
Race
Ancestry
AfghanAfricanAlaska NativeAlaskan AthabascanAlbanianAleutAlsatianAmericanApacheArabArapahoArgentineanArmenianAssyrian/Chaldean/SyriacAustralianAustrianBahamianBangladeshiBarbadianBasqueBelgianBelizeanBermudanBhutaneseBlackfeetBolivianBrazilianBritishBritish West IndianBulgarianBurmeseCajunCambodianCanadianCape VerdeanCarpatho RusynCelticCentral AmericanCentral American IndianCherokeeCheyenneChickasawChileanChineseChippewaChoctawColombianColvilleComancheCosta RicanCreeCreekCroatianCrowCubanCypriotCzechCzechoslovakianDanishDelawareDominicanDutchDutch West IndianEastern EuropeanEcuadorianEgyptianEnglishEstonianEthiopianEuropeanFijianFilipinoFinnishFrenchFrench American IndianFrench CanadianGermanGerman RussianGhanaianGreekGuamanian/ChamorroGuatemalanGuyaneseHaitianHmongHonduranHopiHoumaHungarianIcelanderIndian (Asian)IndonesianInupiatIranianIraqiIrishIroquoisIsraeliItalianJamaicanJapaneseJordanianKenyanKiowaKoreanLaotianLatvianLebaneseLiberianLithuanianLumbeeLuxembourgerMacedonianMalaysianMalteseMarshalleseMenomineeMexicanMexican American IndianMongolianMoroccanNative HawaiianNavajoNepaleseNew ZealanderNicaraguanNigerianNorthern EuropeanNorwegianOkinawanOsageOttawaPaiutePakistaniPalestinianPanamanianParaguayanPennsylvania GermanPeruvianPimaPolishPortuguesePotawatomiPuebloPuerto RicanPuget Sound SalishRomanianRussianSalvadoranSamoanScandinavianScotch-IrishScottishSeminoleSenegaleseSerbianShoshoneSierra LeoneanSiouxSlavicSlovakSloveneSomaliSouth AfricanSouth AmericanSouth American IndianSoviet UnionSpaniardSpanishSpanish AmericanSpanish American IndianSri LankanSubsaharan AfricanSudaneseSwedishSwissSyrianThaiTlingit-HaidaTohono O'OdhamTonganTrinidadian and TobagonianTsimshianTurkishU.S. Virgin IslanderUgandanUkrainianUruguayanUteVenezuelanVietnameseWelshWest IndianYakamaYaquiYugoslavianYumanYup'ikZimbabwean
Immigration
NonimmigrantsImmigrantsAfghanistanAfricaAlbaniaArgentinaArmeniaAsiaAustraliaAustriaBahamasBangladeshBarbadosBelarusBelgiumBelizeBoliviaBosnia and HerzegovinaBrazilBulgariaBurma/MyanmarCabo VerdeCambodiaCameroonCanadaCaribbeanCentral AmericaChileChinaColombiaCongoCosta RicaCroatiaCubaCzechoslovakiaDenmarkDominicaDominican RepublicEastern AfricaEastern AsiaEastern EuropeEcuadorEgyptEl SalvadorEnglandEritreaEthiopiaEuropeFijiFranceGermanyGhanaGreeceGrenadaGuatemalaGuyanaHaitiHondurasHong KongHungaryIndiaIndonesiaIranIraqIrelandIsraelItalyJamaicaJapanJordanKazakhstanKenyaKoreaKuwaitLaosLatin AmericaLatviaLebanonLiberiaLithuaniaMalaysiaMexicoMicronesiaMiddle AfricaMoldovaMoroccoNepalNetherlandsNicaraguaNigeriaNorth AmericaNorth MacedoniaNorthern AfricaNorthern EuropeNorwayOceaniaPakistanPanamaPeruPhilippinesPolandPortugalRomaniaRussiaSaudi ArabiaScotlandSenegalSerbiaSierra LeoneSingaporeSomaliaSouth AfricaSouth AmericaSouth Central AsiaSouth Eastern AsiaSouthern EuropeSpainSri LankaSt. Vincent and the GrenadinesSudanSwedenSwitzerlandSyriaTaiwanThailandTrinidad and TobagoTurkeyUgandaUkraineUruguayUzbekistanVenezuelaVietnamWest IndiesWestern AfricaWestern AsiaWestern EuropeYemenZaireZimbabweAzores
College, 1 year or more
Income
Poverty
Unemployment
Labor Participation
Family Structure
Vehicle Availability
Education Level
Disability

College, 1 year or more Comparison

Taiwanese

Immigrants

Excellent
Tragic
60.7%
COLLEGE, 1 YEAR OR MORE
84.3/ 100
METRIC RATING
138th/ 347
METRIC RANK
57.0%
COLLEGE, 1 YEAR OR MORE
4.4/ 100
METRIC RATING
227th/ 347
METRIC RANK

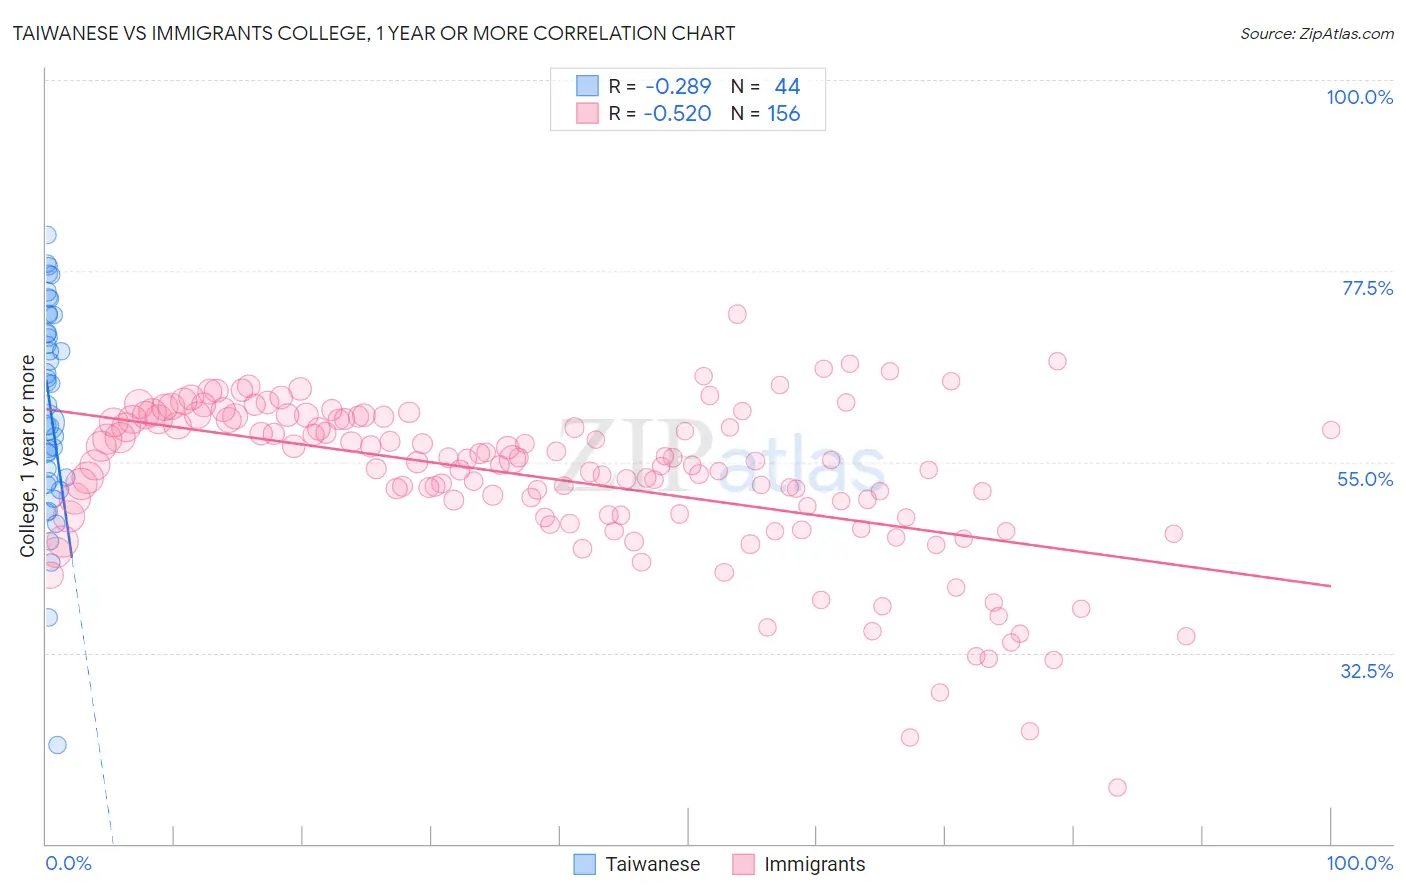
Taiwanese vs Immigrants College, 1 year or more Correlation Chart

The statistical analysis conducted on geographies consisting of 31,724,936 people shows a weak negative correlation between the proportion of Taiwanese and percentage of population with at least college, 1 year or more education in the United States with a correlation coefficient (R) of -0.289 and weighted average of 60.7%. Similarly, the statistical analysis conducted on geographies consisting of 577,748,895 people shows a substantial negative correlation between the proportion of Immigrants and percentage of population with at least college, 1 year or more education in the United States with a correlation coefficient (R) of -0.520 and weighted average of 57.0%, a difference of 6.6%.
Taiwanese vs Immigrants College, 1 year or more

College, 1 year or more Correlation Summary

MeasurementTaiwaneseImmigrants
Minimum21.6%16.7%
Maximum81.7%72.4%
Range60.1%55.7%
Mean61.5%52.9%
Median62.9%54.7%
Interquartile 25% (IQ1)53.0%48.5%
Interquartile 75% (IQ3)71.2%60.0%
Interquartile Range (IQR)18.2%11.5%
Standard Deviation (Sample)12.5%9.5%
Standard Deviation (Population)12.3%9.5%

Similar Demographics by College, 1 year or more

Demographics Similar to Taiwanese by College, 1 year or more

In terms of college, 1 year or more, the demographic groups most similar to Taiwanese are Immigrants from Eritrea (60.7%, a difference of 0.0%), Iraqi (60.7%, a difference of 0.10%), Immigrants from Afghanistan (60.7%, a difference of 0.11%), Polish (60.7%, a difference of 0.15%), and Canadian (60.6%, a difference of 0.15%).
DemographicsRating | RankCollege, 1 year or more
Immigrants | Morocco
89.5
/100
|
#131
Excellent
61.1%
Scandinavians
88.2
/100
|
#132
Excellent
61.0%
Immigrants | Uzbekistan
88.0
/100
|
#133
Excellent
61.0%
Immigrants | Venezuela
87.9
/100
|
#134
Excellent
61.0%
Immigrants | Uganda
87.4
/100
|
#135
Excellent
60.9%
Basques
87.2
/100
|
#136
Excellent
60.9%
Slovenes
86.5
/100
|
#137
Excellent
60.9%
Taiwanese
84.3
/100
|
#138
Excellent
60.7%
Immigrants | Eritrea
84.3
/100
|
#139
Excellent
60.7%
Iraqis
83.3
/100
|
#140
Excellent
60.7%
Immigrants | Afghanistan
83.1
/100
|
#141
Excellent
60.7%
Poles
82.8
/100
|
#142
Excellent
60.7%
Canadians
82.7
/100
|
#143
Excellent
60.6%
Czechs
81.9
/100
|
#144
Excellent
60.6%
Slavs
81.1
/100
|
#145
Excellent
60.6%

Demographics Similar to Immigrants by College, 1 year or more

In terms of college, 1 year or more, the demographic groups most similar to Immigrants are Immigrants from Western Africa (57.0%, a difference of 0.070%), Vietnamese (57.0%, a difference of 0.090%), Immigrants from Fiji (56.9%, a difference of 0.15%), Cree (56.8%, a difference of 0.28%), and Portuguese (57.2%, a difference of 0.30%).
DemographicsRating | RankCollege, 1 year or more
Immigrants | Costa Rica
8.0
/100
|
#220
Tragic
57.5%
Immigrants | Ghana
7.7
/100
|
#221
Tragic
57.4%
Sub-Saharan Africans
6.1
/100
|
#222
Tragic
57.3%
Portuguese
5.4
/100
|
#223
Tragic
57.2%
Hmong
5.4
/100
|
#224
Tragic
57.2%
Vietnamese
4.7
/100
|
#225
Tragic
57.0%
Immigrants | Western Africa
4.6
/100
|
#226
Tragic
57.0%
Immigrants | Immigrants
4.4
/100
|
#227
Tragic
57.0%
Immigrants | Fiji
4.0
/100
|
#228
Tragic
56.9%
Cree
3.6
/100
|
#229
Tragic
56.8%
Liberians
3.1
/100
|
#230
Tragic
56.7%
Immigrants | Burma/Myanmar
2.7
/100
|
#231
Tragic
56.6%
Immigrants | Bangladesh
2.6
/100
|
#232
Tragic
56.6%
Immigrants | Nonimmigrants
2.5
/100
|
#233
Tragic
56.5%
Spanish Americans
1.8
/100
|
#234
Tragic
56.3%