Immigrants from Congo vs Immigrants College, 1 year or more
COMPARE
Immigrants from Congo
Immigrants
College, 1 year or more
College, 1 year or more Comparison
Immigrants from Congo
Immigrants
55.6%
COLLEGE, 1 YEAR OR MORE
0.8/ 100
METRIC RATING
248th/ 347
METRIC RANK
57.0%
COLLEGE, 1 YEAR OR MORE
4.4/ 100
METRIC RATING
227th/ 347
METRIC RANK
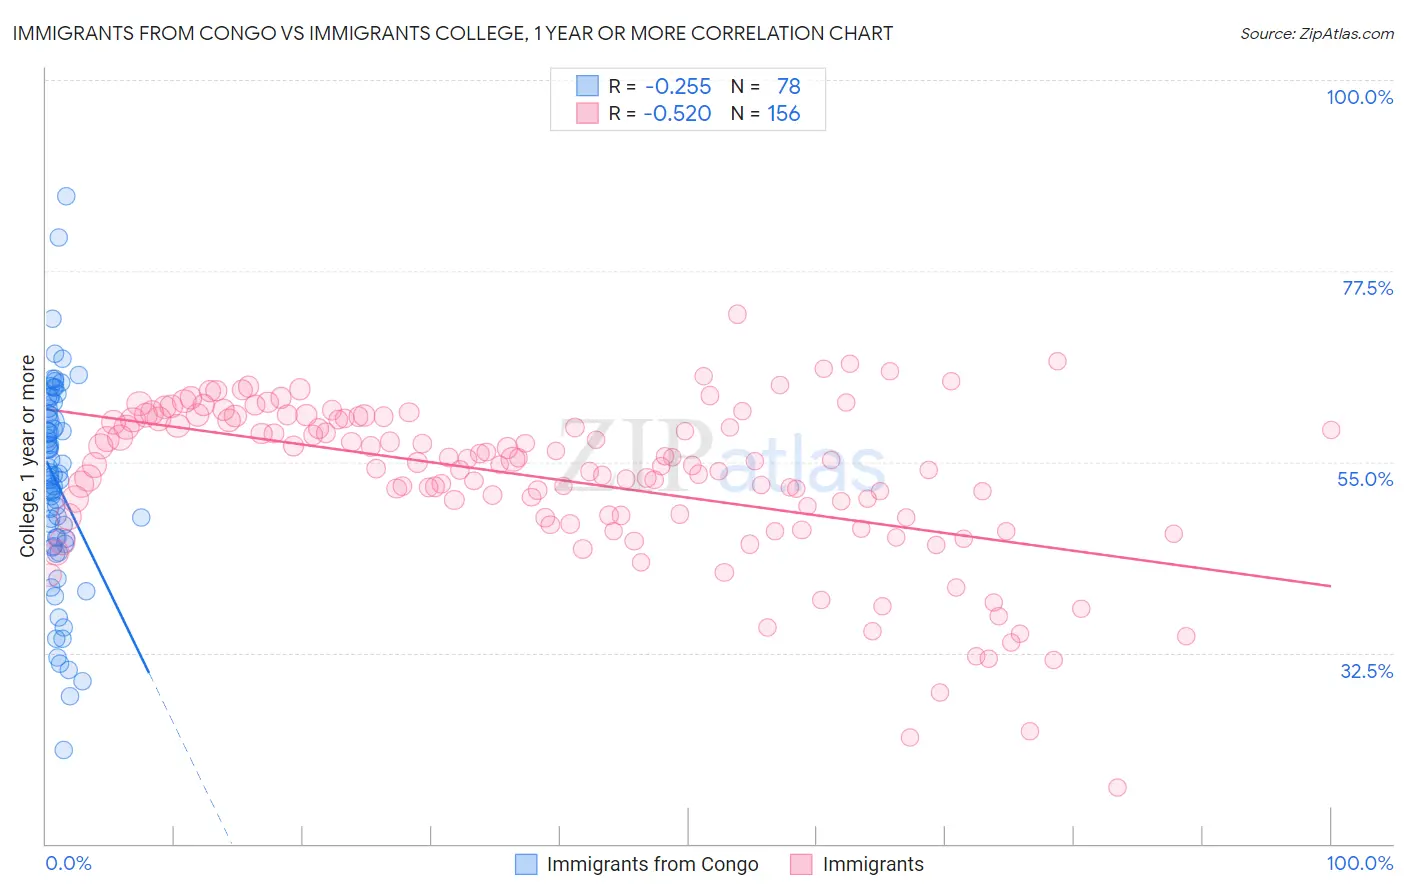
Immigrants from Congo vs Immigrants College, 1 year or more Correlation Chart
The statistical analysis conducted on geographies consisting of 92,129,670 people shows a weak negative correlation between the proportion of Immigrants from Congo and percentage of population with at least college, 1 year or more education in the United States with a correlation coefficient (R) of -0.255 and weighted average of 55.6%. Similarly, the statistical analysis conducted on geographies consisting of 577,748,895 people shows a substantial negative correlation between the proportion of Immigrants and percentage of population with at least college, 1 year or more education in the United States with a correlation coefficient (R) of -0.520 and weighted average of 57.0%, a difference of 2.6%.
College, 1 year or more Correlation Summary
| Measurement | Immigrants from Congo | Immigrants |
| Minimum | 21.1% | 16.7% |
| Maximum | 86.2% | 72.4% |
| Range | 65.2% | 55.7% |
| Mean | 52.5% | 52.9% |
| Median | 53.4% | 54.7% |
| Interquartile 25% (IQ1) | 46.0% | 48.5% |
| Interquartile 75% (IQ3) | 60.7% | 60.0% |
| Interquartile Range (IQR) | 14.7% | 11.5% |
| Standard Deviation (Sample) | 11.9% | 9.5% |
| Standard Deviation (Population) | 11.8% | 9.5% |
Similar Demographics by College, 1 year or more
Demographics Similar to Immigrants from Congo by College, 1 year or more
In terms of college, 1 year or more, the demographic groups most similar to Immigrants from Congo are Hawaiian (55.6%, a difference of 0.040%), Immigrants from Trinidad and Tobago (55.5%, a difference of 0.10%), Malaysian (55.6%, a difference of 0.11%), Delaware (55.5%, a difference of 0.12%), and Immigrants from Liberia (55.7%, a difference of 0.16%).
| Demographics | Rating | Rank | College, 1 year or more |
| French American Indians | 1.0 /100 | #241 | Tragic 55.8% |
| Marshallese | 1.0 /100 | #242 | Tragic 55.8% |
| Osage | 1.0 /100 | #243 | Tragic 55.8% |
| Chippewa | 0.9 /100 | #244 | Tragic 55.7% |
| Immigrants | Liberia | 0.8 /100 | #245 | Tragic 55.7% |
| Malaysians | 0.8 /100 | #246 | Tragic 55.6% |
| Hawaiians | 0.8 /100 | #247 | Tragic 55.6% |
| Immigrants | Congo | 0.8 /100 | #248 | Tragic 55.6% |
| Immigrants | Trinidad and Tobago | 0.7 /100 | #249 | Tragic 55.5% |
| Delaware | 0.7 /100 | #250 | Tragic 55.5% |
| Immigrants | Cambodia | 0.6 /100 | #251 | Tragic 55.4% |
| Aleuts | 0.6 /100 | #252 | Tragic 55.4% |
| Immigrants | Barbados | 0.6 /100 | #253 | Tragic 55.4% |
| Japanese | 0.5 /100 | #254 | Tragic 55.2% |
| Immigrants | Bahamas | 0.5 /100 | #255 | Tragic 55.2% |
Demographics Similar to Immigrants by College, 1 year or more
In terms of college, 1 year or more, the demographic groups most similar to Immigrants are Immigrants from Western Africa (57.0%, a difference of 0.070%), Vietnamese (57.0%, a difference of 0.090%), Immigrants from Fiji (56.9%, a difference of 0.15%), Cree (56.8%, a difference of 0.28%), and Portuguese (57.2%, a difference of 0.30%).
| Demographics | Rating | Rank | College, 1 year or more |
| Immigrants | Costa Rica | 8.0 /100 | #220 | Tragic 57.5% |
| Immigrants | Ghana | 7.7 /100 | #221 | Tragic 57.4% |
| Sub-Saharan Africans | 6.1 /100 | #222 | Tragic 57.3% |
| Portuguese | 5.4 /100 | #223 | Tragic 57.2% |
| Hmong | 5.4 /100 | #224 | Tragic 57.2% |
| Vietnamese | 4.7 /100 | #225 | Tragic 57.0% |
| Immigrants | Western Africa | 4.6 /100 | #226 | Tragic 57.0% |
| Immigrants | Immigrants | 4.4 /100 | #227 | Tragic 57.0% |
| Immigrants | Fiji | 4.0 /100 | #228 | Tragic 56.9% |
| Cree | 3.6 /100 | #229 | Tragic 56.8% |
| Liberians | 3.1 /100 | #230 | Tragic 56.7% |
| Immigrants | Burma/Myanmar | 2.7 /100 | #231 | Tragic 56.6% |
| Immigrants | Bangladesh | 2.6 /100 | #232 | Tragic 56.6% |
| Immigrants | Nonimmigrants | 2.5 /100 | #233 | Tragic 56.5% |
| Spanish Americans | 1.8 /100 | #234 | Tragic 56.3% |