Syrian vs Puget Sound Salish 4th Grade
COMPARE
Syrian
Puget Sound Salish
4th Grade
4th Grade Comparison
Syrians
Puget Sound Salish
97.8%
4TH GRADE
94.9/ 100
METRIC RATING
117th/ 347
METRIC RANK
97.9%
4TH GRADE
97.7/ 100
METRIC RATING
103rd/ 347
METRIC RANK
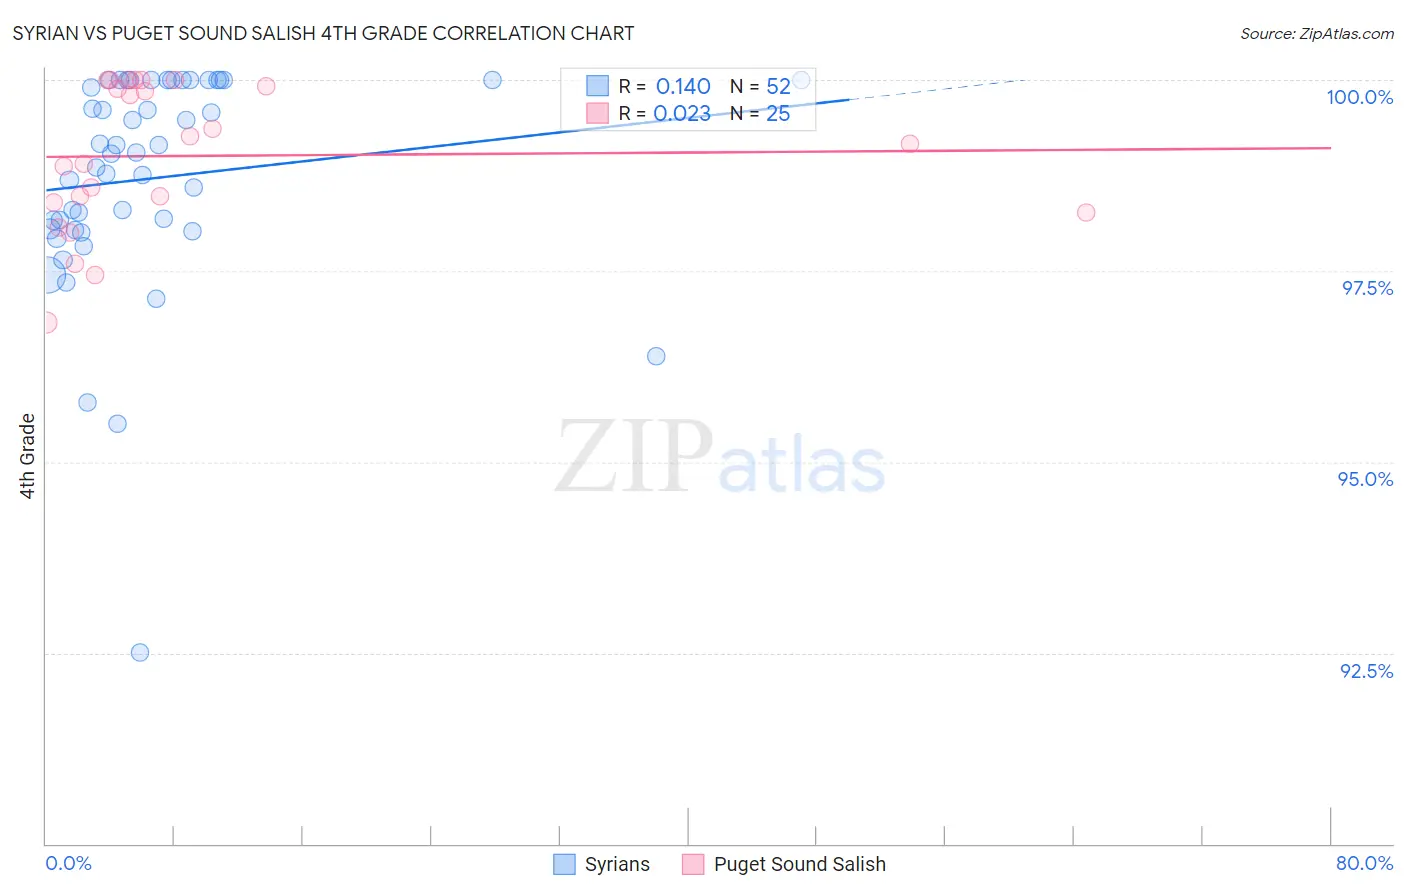
Syrian vs Puget Sound Salish 4th Grade Correlation Chart
The statistical analysis conducted on geographies consisting of 266,305,988 people shows a poor positive correlation between the proportion of Syrians and percentage of population with at least 4th grade education in the United States with a correlation coefficient (R) of 0.140 and weighted average of 97.8%. Similarly, the statistical analysis conducted on geographies consisting of 46,155,746 people shows no correlation between the proportion of Puget Sound Salish and percentage of population with at least 4th grade education in the United States with a correlation coefficient (R) of 0.023 and weighted average of 97.9%, a difference of 0.080%.
4th Grade Correlation Summary
| Measurement | Syrian | Puget Sound Salish |
| Minimum | 92.5% | 96.8% |
| Maximum | 100.0% | 100.0% |
| Range | 7.5% | 3.2% |
| Mean | 98.7% | 99.0% |
| Median | 99.0% | 99.2% |
| Interquartile 25% (IQ1) | 98.0% | 98.3% |
| Interquartile 75% (IQ3) | 100.0% | 100.0% |
| Interquartile Range (IQR) | 2.0% | 1.6% |
| Standard Deviation (Sample) | 1.4% | 0.95% |
| Standard Deviation (Population) | 1.4% | 0.94% |
Demographics Similar to Syrians and Puget Sound Salish by 4th Grade
In terms of 4th grade, the demographic groups most similar to Syrians are Menominee (97.8%, a difference of 0.0%), Immigrants from Saudi Arabia (97.8%, a difference of 0.0%), Immigrants from France (97.8%, a difference of 0.0%), Iroquois (97.8%, a difference of 0.010%), and Lebanese (97.8%, a difference of 0.010%). Similarly, the demographic groups most similar to Puget Sound Salish are Choctaw (97.9%, a difference of 0.010%), Nonimmigrants (97.9%, a difference of 0.010%), German Russian (97.9%, a difference of 0.010%), Immigrants from Czechoslovakia (97.9%, a difference of 0.010%), and Bhutanese (97.9%, a difference of 0.010%).
| Demographics | Rating | Rank | 4th Grade |
| Yugoslavians | 98.1 /100 | #100 | Exceptional 97.9% |
| Cree | 98.1 /100 | #101 | Exceptional 97.9% |
| Choctaw | 97.9 /100 | #102 | Exceptional 97.9% |
| Puget Sound Salish | 97.7 /100 | #103 | Exceptional 97.9% |
| Immigrants | Nonimmigrants | 97.5 /100 | #104 | Exceptional 97.9% |
| German Russians | 97.5 /100 | #105 | Exceptional 97.9% |
| Immigrants | Czechoslovakia | 97.5 /100 | #106 | Exceptional 97.9% |
| Bhutanese | 97.4 /100 | #107 | Exceptional 97.9% |
| Immigrants | Singapore | 97.3 /100 | #108 | Exceptional 97.9% |
| Immigrants | Latvia | 96.8 /100 | #109 | Exceptional 97.8% |
| Thais | 96.7 /100 | #110 | Exceptional 97.8% |
| Immigrants | Switzerland | 96.1 /100 | #111 | Exceptional 97.8% |
| Okinawans | 96.0 /100 | #112 | Exceptional 97.8% |
| Basques | 95.8 /100 | #113 | Exceptional 97.8% |
| Iroquois | 95.4 /100 | #114 | Exceptional 97.8% |
| Lebanese | 95.4 /100 | #115 | Exceptional 97.8% |
| Immigrants | Croatia | 95.2 /100 | #116 | Exceptional 97.8% |
| Syrians | 94.9 /100 | #117 | Exceptional 97.8% |
| Menominee | 94.9 /100 | #118 | Exceptional 97.8% |
| Immigrants | Saudi Arabia | 94.8 /100 | #119 | Exceptional 97.8% |
| Immigrants | France | 94.8 /100 | #120 | Exceptional 97.8% |