Immigrants from Uruguay vs Ugandan High School Diploma
COMPARE
Immigrants from Uruguay
Ugandan
High School Diploma
High School Diploma Comparison
Immigrants from Uruguay
Ugandans
87.6%
HIGH SCHOOL DIPLOMA
1.0/ 100
METRIC RATING
253rd/ 347
METRIC RANK
89.7%
HIGH SCHOOL DIPLOMA
83.7/ 100
METRIC RATING
136th/ 347
METRIC RANK
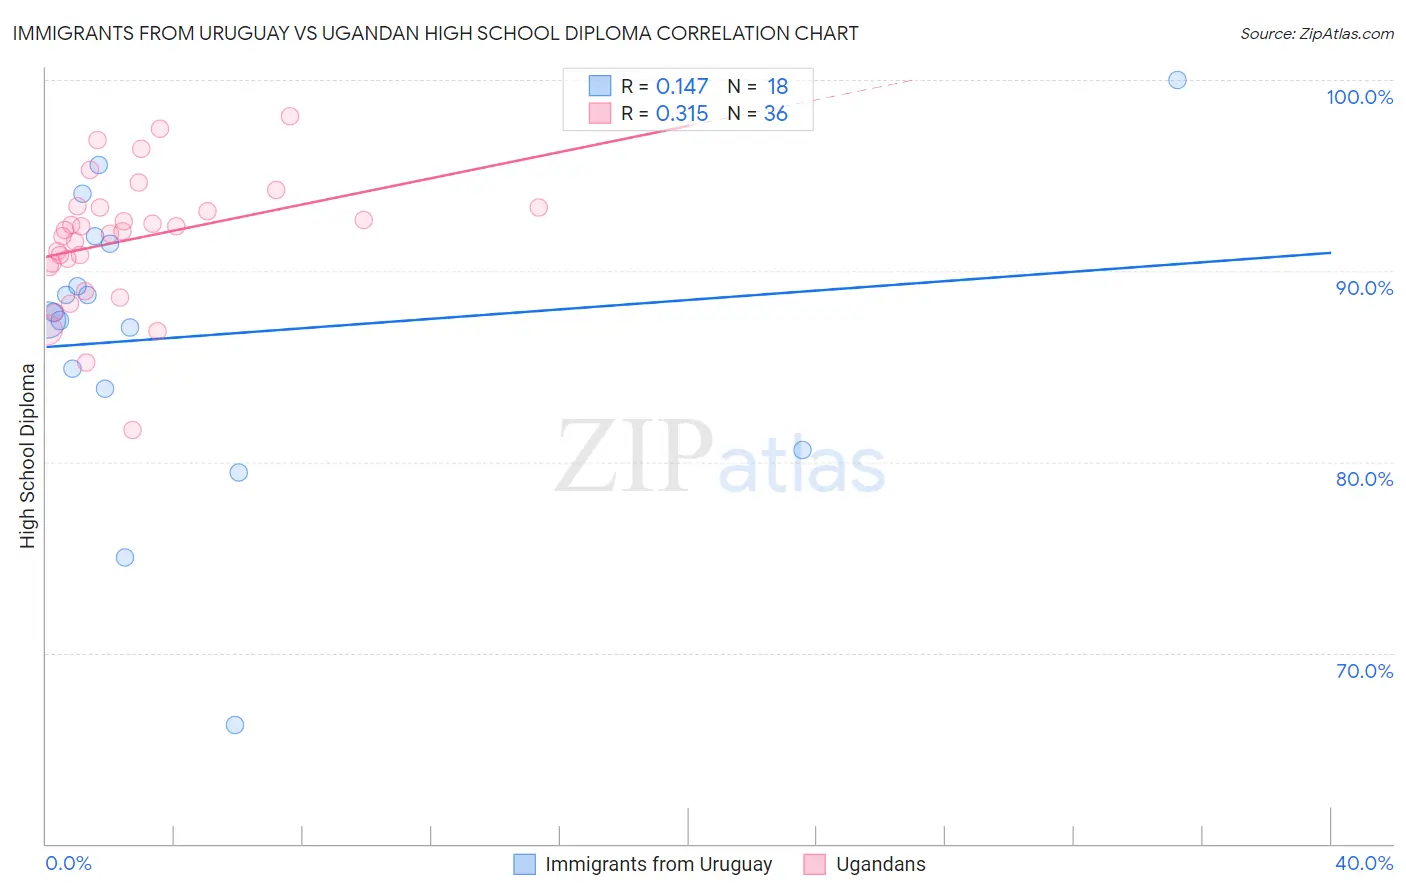
Immigrants from Uruguay vs Ugandan High School Diploma Correlation Chart
The statistical analysis conducted on geographies consisting of 133,259,667 people shows a poor positive correlation between the proportion of Immigrants from Uruguay and percentage of population with at least high school diploma education in the United States with a correlation coefficient (R) of 0.147 and weighted average of 87.6%. Similarly, the statistical analysis conducted on geographies consisting of 93,991,892 people shows a mild positive correlation between the proportion of Ugandans and percentage of population with at least high school diploma education in the United States with a correlation coefficient (R) of 0.315 and weighted average of 89.7%, a difference of 2.4%.
High School Diploma Correlation Summary
| Measurement | Immigrants from Uruguay | Ugandan |
| Minimum | 66.2% | 81.7% |
| Maximum | 100.0% | 98.1% |
| Range | 33.8% | 16.4% |
| Mean | 86.6% | 91.6% |
| Median | 87.6% | 92.1% |
| Interquartile 25% (IQ1) | 83.8% | 90.3% |
| Interquartile 75% (IQ3) | 91.4% | 93.3% |
| Interquartile Range (IQR) | 7.6% | 3.0% |
| Standard Deviation (Sample) | 7.8% | 3.4% |
| Standard Deviation (Population) | 7.6% | 3.4% |
Similar Demographics by High School Diploma
Demographics Similar to Immigrants from Uruguay by High School Diploma
In terms of high school diploma, the demographic groups most similar to Immigrants from Uruguay are Immigrants from Colombia (87.6%, a difference of 0.010%), Immigrants from South America (87.6%, a difference of 0.050%), Immigrants from Senegal (87.6%, a difference of 0.060%), Ghanaian (87.7%, a difference of 0.11%), and Senegalese (87.7%, a difference of 0.15%).
| Demographics | Rating | Rank | High School Diploma |
| Immigrants | Eritrea | 1.7 /100 | #246 | Tragic 87.8% |
| Immigrants | Costa Rica | 1.7 /100 | #247 | Tragic 87.8% |
| Spanish Americans | 1.5 /100 | #248 | Tragic 87.7% |
| Senegalese | 1.5 /100 | #249 | Tragic 87.7% |
| Immigrants | Nigeria | 1.5 /100 | #250 | Tragic 87.7% |
| Ghanaians | 1.4 /100 | #251 | Tragic 87.7% |
| Immigrants | South America | 1.2 /100 | #252 | Tragic 87.6% |
| Immigrants | Uruguay | 1.0 /100 | #253 | Tragic 87.6% |
| Immigrants | Colombia | 1.0 /100 | #254 | Tragic 87.6% |
| Immigrants | Senegal | 0.9 /100 | #255 | Tragic 87.6% |
| Africans | 0.7 /100 | #256 | Tragic 87.5% |
| Bahamians | 0.7 /100 | #257 | Tragic 87.5% |
| Immigrants | Ghana | 0.5 /100 | #258 | Tragic 87.4% |
| Immigrants | Western Africa | 0.5 /100 | #259 | Tragic 87.4% |
| Cajuns | 0.4 /100 | #260 | Tragic 87.3% |
Demographics Similar to Ugandans by High School Diploma
In terms of high school diploma, the demographic groups most similar to Ugandans are Arab (89.7%, a difference of 0.0%), Assyrian/Chaldean/Syriac (89.7%, a difference of 0.030%), Chippewa (89.7%, a difference of 0.060%), Kenyan (89.6%, a difference of 0.060%), and Immigrants from Egypt (89.6%, a difference of 0.070%).
| Demographics | Rating | Rank | High School Diploma |
| Basques | 88.5 /100 | #129 | Excellent 89.8% |
| Immigrants | Ukraine | 87.9 /100 | #130 | Excellent 89.8% |
| Immigrants | Italy | 87.4 /100 | #131 | Excellent 89.8% |
| Immigrants | Bosnia and Herzegovina | 87.3 /100 | #132 | Excellent 89.8% |
| Albanians | 87.2 /100 | #133 | Excellent 89.8% |
| Immigrants | Jordan | 87.2 /100 | #134 | Excellent 89.8% |
| Chippewa | 85.6 /100 | #135 | Excellent 89.7% |
| Ugandans | 83.7 /100 | #136 | Excellent 89.7% |
| Arabs | 83.6 /100 | #137 | Excellent 89.7% |
| Assyrians/Chaldeans/Syriacs | 82.5 /100 | #138 | Excellent 89.7% |
| Kenyans | 81.4 /100 | #139 | Excellent 89.6% |
| Immigrants | Egypt | 81.2 /100 | #140 | Excellent 89.6% |
| Chileans | 79.0 /100 | #141 | Good 89.6% |
| Indians (Asian) | 78.8 /100 | #142 | Good 89.6% |
| Pakistanis | 78.3 /100 | #143 | Good 89.6% |