Swiss vs Immigrants from Greece High School Diploma
COMPARE
Swiss
Immigrants from Greece
High School Diploma
High School Diploma Comparison
Swiss
Immigrants from Greece
90.6%
HIGH SCHOOL DIPLOMA
98.6/ 100
METRIC RATING
92nd/ 347
METRIC RANK
90.3%
HIGH SCHOOL DIPLOMA
96.6/ 100
METRIC RATING
110th/ 347
METRIC RANK
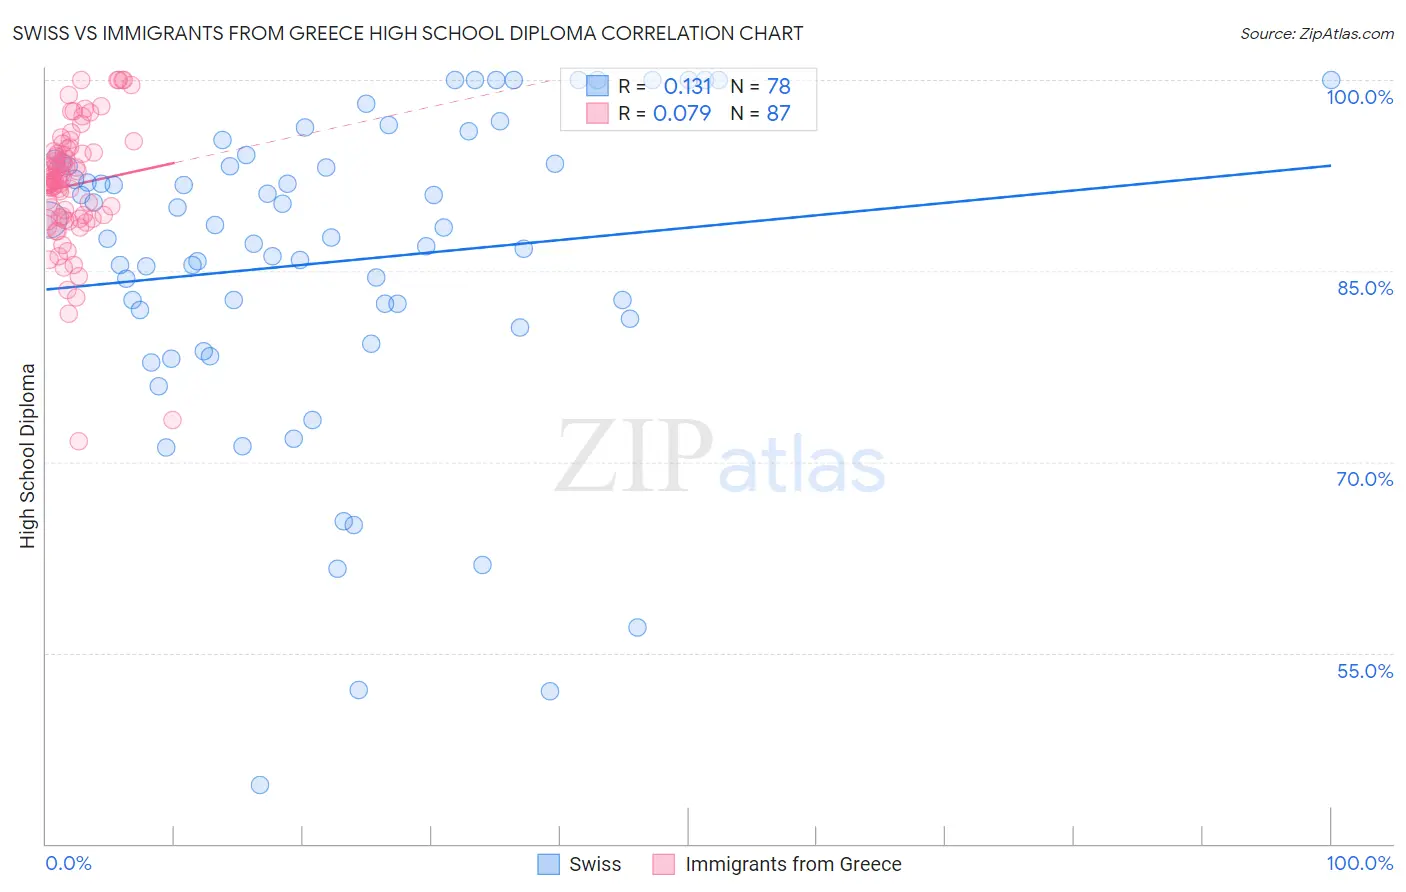
Swiss vs Immigrants from Greece High School Diploma Correlation Chart
The statistical analysis conducted on geographies consisting of 465,022,572 people shows a poor positive correlation between the proportion of Swiss and percentage of population with at least high school diploma education in the United States with a correlation coefficient (R) of 0.131 and weighted average of 90.6%. Similarly, the statistical analysis conducted on geographies consisting of 216,879,847 people shows a slight positive correlation between the proportion of Immigrants from Greece and percentage of population with at least high school diploma education in the United States with a correlation coefficient (R) of 0.079 and weighted average of 90.3%, a difference of 0.33%.
High School Diploma Correlation Summary
| Measurement | Swiss | Immigrants from Greece |
| Minimum | 44.6% | 71.6% |
| Maximum | 100.0% | 100.0% |
| Range | 55.4% | 28.4% |
| Mean | 85.7% | 91.7% |
| Median | 88.0% | 92.2% |
| Interquartile 25% (IQ1) | 81.2% | 89.1% |
| Interquartile 75% (IQ3) | 93.5% | 94.4% |
| Interquartile Range (IQR) | 12.2% | 5.4% |
| Standard Deviation (Sample) | 12.4% | 5.1% |
| Standard Deviation (Population) | 12.3% | 5.0% |
Demographics Similar to Swiss and Immigrants from Greece by High School Diploma
In terms of high school diploma, the demographic groups most similar to Swiss are Immigrants from Western Europe (90.6%, a difference of 0.0%), South African (90.6%, a difference of 0.010%), Immigrants from Israel (90.5%, a difference of 0.020%), Icelander (90.5%, a difference of 0.030%), and Immigrants from Serbia (90.5%, a difference of 0.040%). Similarly, the demographic groups most similar to Immigrants from Greece are Menominee (90.3%, a difference of 0.0%), Palestinian (90.3%, a difference of 0.010%), Immigrants from Zimbabwe (90.3%, a difference of 0.010%), Immigrants from Russia (90.3%, a difference of 0.030%), and Syrian (90.3%, a difference of 0.050%).
| Demographics | Rating | Rank | High School Diploma |
| South Africans | 98.6 /100 | #91 | Exceptional 90.6% |
| Swiss | 98.6 /100 | #92 | Exceptional 90.6% |
| Immigrants | Western Europe | 98.6 /100 | #93 | Exceptional 90.6% |
| Immigrants | Israel | 98.5 /100 | #94 | Exceptional 90.5% |
| Icelanders | 98.5 /100 | #95 | Exceptional 90.5% |
| Immigrants | Serbia | 98.4 /100 | #96 | Exceptional 90.5% |
| Immigrants | Kuwait | 98.3 /100 | #97 | Exceptional 90.5% |
| Immigrants | Korea | 98.3 /100 | #98 | Exceptional 90.5% |
| Immigrants | Europe | 98.2 /100 | #99 | Exceptional 90.5% |
| Immigrants | North Macedonia | 98.1 /100 | #100 | Exceptional 90.5% |
| Immigrants | Norway | 98.0 /100 | #101 | Exceptional 90.5% |
| Aleuts | 98.0 /100 | #102 | Exceptional 90.4% |
| Immigrants | Romania | 97.8 /100 | #103 | Exceptional 90.4% |
| Immigrants | Croatia | 97.8 /100 | #104 | Exceptional 90.4% |
| Lebanese | 97.4 /100 | #105 | Exceptional 90.4% |
| Syrians | 97.0 /100 | #106 | Exceptional 90.3% |
| Immigrants | Russia | 96.9 /100 | #107 | Exceptional 90.3% |
| Palestinians | 96.7 /100 | #108 | Exceptional 90.3% |
| Immigrants | Zimbabwe | 96.7 /100 | #109 | Exceptional 90.3% |
| Immigrants | Greece | 96.6 /100 | #110 | Exceptional 90.3% |
| Menominee | 96.6 /100 | #111 | Exceptional 90.3% |