Immigrants from Austria vs Ugandan High School Diploma
COMPARE
Immigrants from Austria
Ugandan
High School Diploma
High School Diploma Comparison
Immigrants from Austria
Ugandans
91.3%
HIGH SCHOOL DIPLOMA
99.8/ 100
METRIC RATING
44th/ 347
METRIC RANK
89.7%
HIGH SCHOOL DIPLOMA
83.7/ 100
METRIC RATING
136th/ 347
METRIC RANK
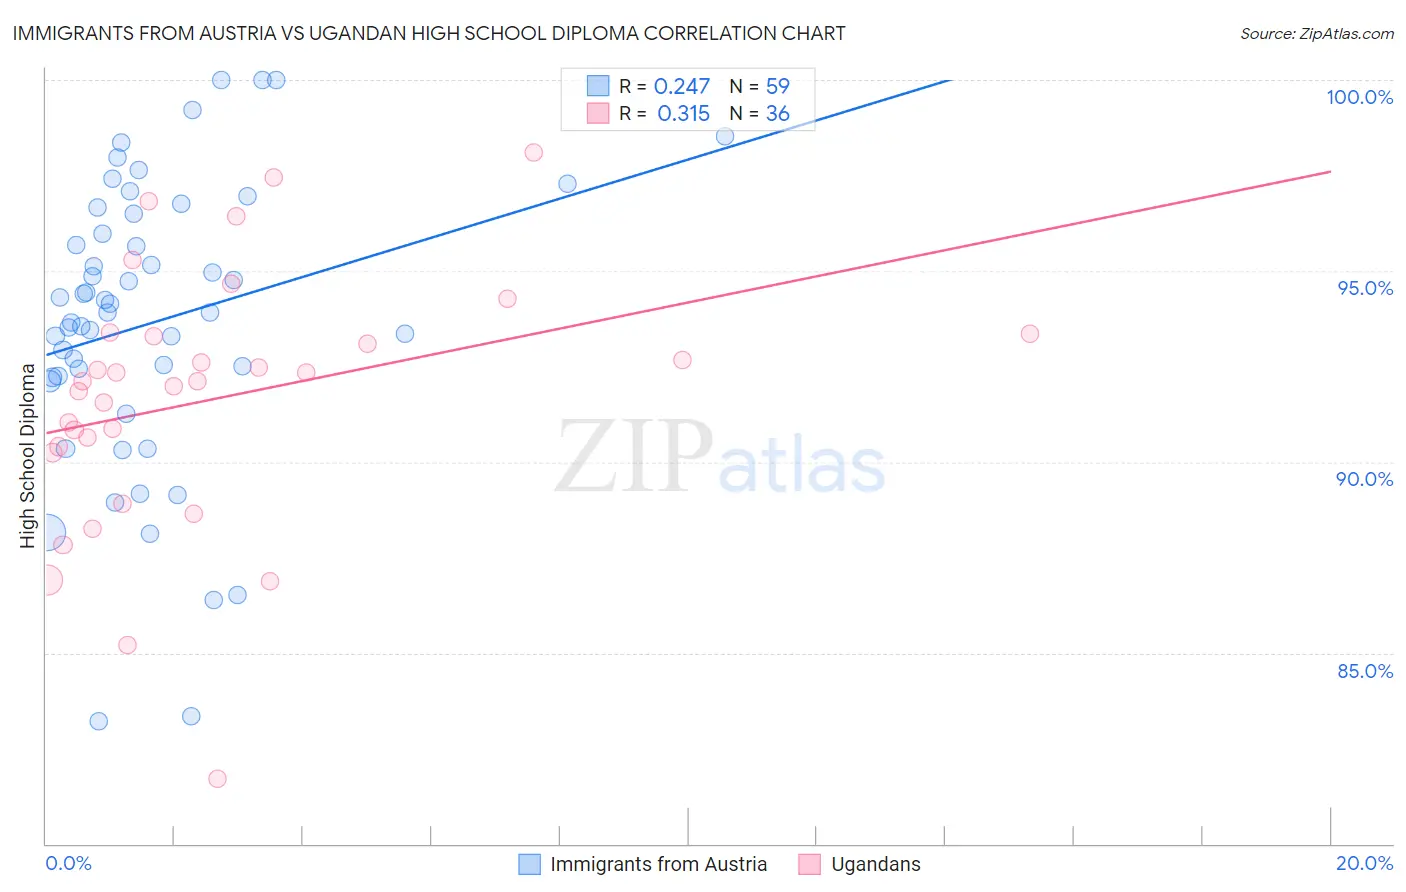
Immigrants from Austria vs Ugandan High School Diploma Correlation Chart
The statistical analysis conducted on geographies consisting of 167,973,751 people shows a weak positive correlation between the proportion of Immigrants from Austria and percentage of population with at least high school diploma education in the United States with a correlation coefficient (R) of 0.247 and weighted average of 91.3%. Similarly, the statistical analysis conducted on geographies consisting of 93,991,892 people shows a mild positive correlation between the proportion of Ugandans and percentage of population with at least high school diploma education in the United States with a correlation coefficient (R) of 0.315 and weighted average of 89.7%, a difference of 1.7%.
High School Diploma Correlation Summary
| Measurement | Immigrants from Austria | Ugandan |
| Minimum | 83.2% | 81.7% |
| Maximum | 100.0% | 98.1% |
| Range | 16.8% | 16.4% |
| Mean | 93.7% | 91.6% |
| Median | 93.9% | 92.1% |
| Interquartile 25% (IQ1) | 92.2% | 90.3% |
| Interquartile 75% (IQ3) | 96.5% | 93.3% |
| Interquartile Range (IQR) | 4.3% | 3.0% |
| Standard Deviation (Sample) | 3.8% | 3.4% |
| Standard Deviation (Population) | 3.7% | 3.4% |
Similar Demographics by High School Diploma
Demographics Similar to Immigrants from Austria by High School Diploma
In terms of high school diploma, the demographic groups most similar to Immigrants from Austria are Turkish (91.2%, a difference of 0.0%), British (91.3%, a difference of 0.010%), Northern European (91.3%, a difference of 0.020%), Immigrants from Australia (91.3%, a difference of 0.030%), and Greek (91.2%, a difference of 0.040%).
| Demographics | Rating | Rank | High School Diploma |
| Immigrants | Ireland | 99.9 /100 | #37 | Exceptional 91.3% |
| Immigrants | Scotland | 99.8 /100 | #38 | Exceptional 91.3% |
| Dutch | 99.8 /100 | #39 | Exceptional 91.3% |
| Immigrants | Lithuania | 99.8 /100 | #40 | Exceptional 91.3% |
| Immigrants | Australia | 99.8 /100 | #41 | Exceptional 91.3% |
| Northern Europeans | 99.8 /100 | #42 | Exceptional 91.3% |
| British | 99.8 /100 | #43 | Exceptional 91.3% |
| Immigrants | Austria | 99.8 /100 | #44 | Exceptional 91.3% |
| Turks | 99.8 /100 | #45 | Exceptional 91.2% |
| Greeks | 99.8 /100 | #46 | Exceptional 91.2% |
| Australians | 99.8 /100 | #47 | Exceptional 91.2% |
| Belgians | 99.8 /100 | #48 | Exceptional 91.2% |
| Bhutanese | 99.8 /100 | #49 | Exceptional 91.2% |
| Welsh | 99.8 /100 | #50 | Exceptional 91.2% |
| New Zealanders | 99.7 /100 | #51 | Exceptional 91.1% |
Demographics Similar to Ugandans by High School Diploma
In terms of high school diploma, the demographic groups most similar to Ugandans are Arab (89.7%, a difference of 0.0%), Assyrian/Chaldean/Syriac (89.7%, a difference of 0.030%), Chippewa (89.7%, a difference of 0.060%), Kenyan (89.6%, a difference of 0.060%), and Immigrants from Egypt (89.6%, a difference of 0.070%).
| Demographics | Rating | Rank | High School Diploma |
| Basques | 88.5 /100 | #129 | Excellent 89.8% |
| Immigrants | Ukraine | 87.9 /100 | #130 | Excellent 89.8% |
| Immigrants | Italy | 87.4 /100 | #131 | Excellent 89.8% |
| Immigrants | Bosnia and Herzegovina | 87.3 /100 | #132 | Excellent 89.8% |
| Albanians | 87.2 /100 | #133 | Excellent 89.8% |
| Immigrants | Jordan | 87.2 /100 | #134 | Excellent 89.8% |
| Chippewa | 85.6 /100 | #135 | Excellent 89.7% |
| Ugandans | 83.7 /100 | #136 | Excellent 89.7% |
| Arabs | 83.6 /100 | #137 | Excellent 89.7% |
| Assyrians/Chaldeans/Syriacs | 82.5 /100 | #138 | Excellent 89.7% |
| Kenyans | 81.4 /100 | #139 | Excellent 89.6% |
| Immigrants | Egypt | 81.2 /100 | #140 | Excellent 89.6% |
| Chileans | 79.0 /100 | #141 | Good 89.6% |
| Indians (Asian) | 78.8 /100 | #142 | Good 89.6% |
| Pakistanis | 78.3 /100 | #143 | Good 89.6% |