Swiss vs Immigrants from Armenia 1st Grade
COMPARE
Swiss
Immigrants from Armenia
1st Grade
1st Grade Comparison
Swiss
Immigrants from Armenia
98.5%
1ST GRADE
100.0/ 100
METRIC RATING
34th/ 347
METRIC RANK
96.6%
1ST GRADE
0.0/ 100
METRIC RATING
331st/ 347
METRIC RANK
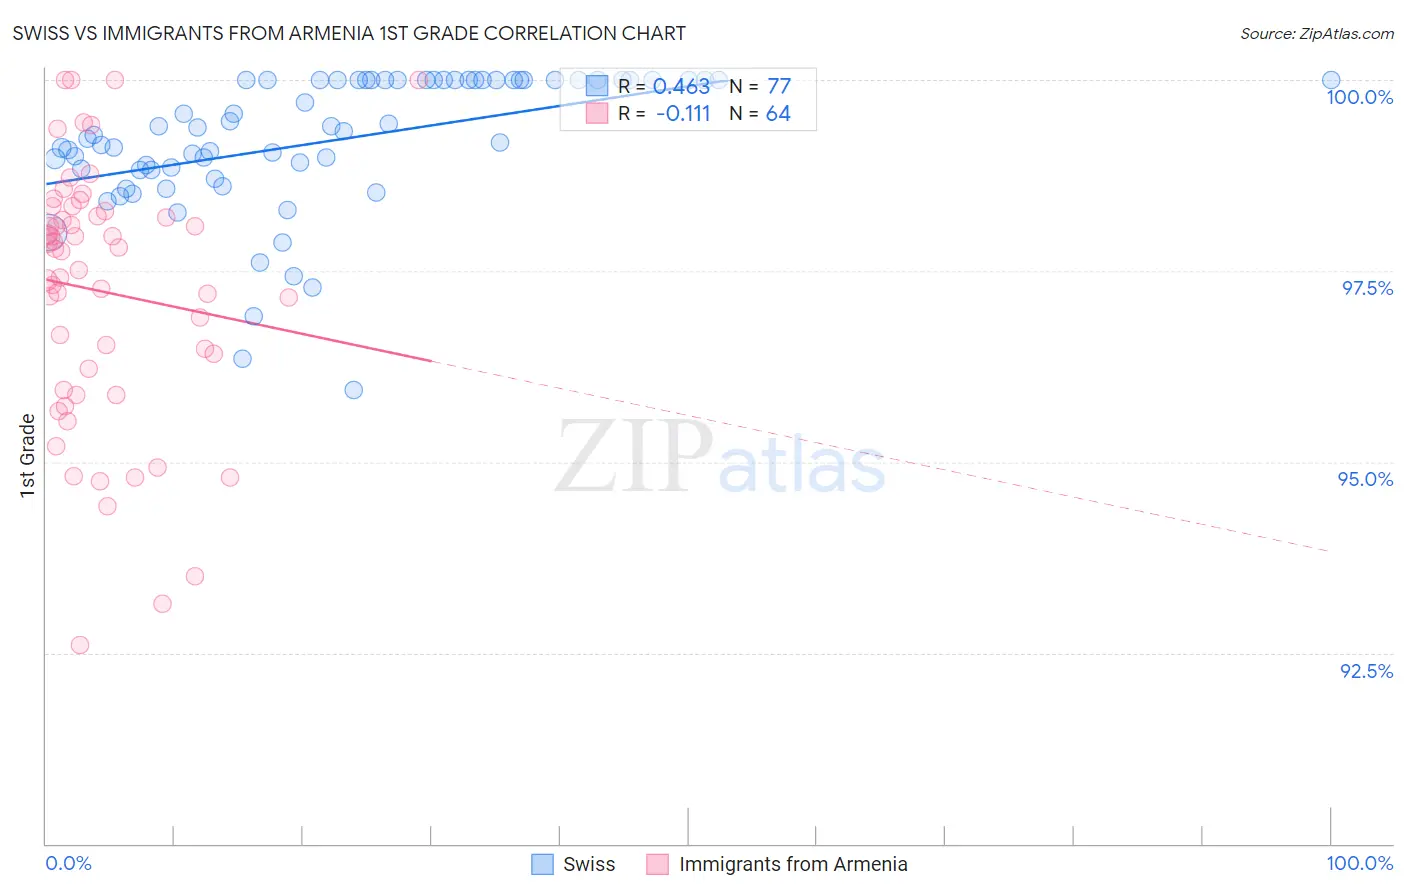
Swiss vs Immigrants from Armenia 1st Grade Correlation Chart
The statistical analysis conducted on geographies consisting of 465,023,158 people shows a moderate positive correlation between the proportion of Swiss and percentage of population with at least 1st grade education in the United States with a correlation coefficient (R) of 0.463 and weighted average of 98.5%. Similarly, the statistical analysis conducted on geographies consisting of 97,725,276 people shows a poor negative correlation between the proportion of Immigrants from Armenia and percentage of population with at least 1st grade education in the United States with a correlation coefficient (R) of -0.111 and weighted average of 96.6%, a difference of 2.0%.
1st Grade Correlation Summary
| Measurement | Swiss | Immigrants from Armenia |
| Minimum | 95.9% | 92.6% |
| Maximum | 100.0% | 100.0% |
| Range | 4.1% | 7.4% |
| Mean | 99.2% | 97.2% |
| Median | 99.3% | 97.8% |
| Interquartile 25% (IQ1) | 98.8% | 96.1% |
| Interquartile 75% (IQ3) | 100.0% | 98.2% |
| Interquartile Range (IQR) | 1.2% | 2.2% |
| Standard Deviation (Sample) | 0.91% | 1.7% |
| Standard Deviation (Population) | 0.90% | 1.7% |
Similar Demographics by 1st Grade
Demographics Similar to Swiss by 1st Grade
In terms of 1st grade, the demographic groups most similar to Swiss are Chinese (98.5%, a difference of 0.0%), Scandinavian (98.5%, a difference of 0.020%), British (98.5%, a difference of 0.020%), European (98.5%, a difference of 0.030%), and Czech (98.5%, a difference of 0.030%).
| Demographics | Rating | Rank | 1st Grade |
| Poles | 100.0 /100 | #27 | Exceptional 98.6% |
| Croatians | 100.0 /100 | #28 | Exceptional 98.6% |
| French | 100.0 /100 | #29 | Exceptional 98.6% |
| Europeans | 100.0 /100 | #30 | Exceptional 98.5% |
| Czechs | 100.0 /100 | #31 | Exceptional 98.5% |
| French Canadians | 100.0 /100 | #32 | Exceptional 98.5% |
| Scandinavians | 100.0 /100 | #33 | Exceptional 98.5% |
| Swiss | 100.0 /100 | #34 | Exceptional 98.5% |
| Chinese | 100.0 /100 | #35 | Exceptional 98.5% |
| British | 100.0 /100 | #36 | Exceptional 98.5% |
| Italians | 99.9 /100 | #37 | Exceptional 98.5% |
| Chippewa | 99.9 /100 | #38 | Exceptional 98.5% |
| Latvians | 99.9 /100 | #39 | Exceptional 98.5% |
| Luxembourgers | 99.9 /100 | #40 | Exceptional 98.5% |
| Eastern Europeans | 99.9 /100 | #41 | Exceptional 98.5% |
Demographics Similar to Immigrants from Armenia by 1st Grade
In terms of 1st grade, the demographic groups most similar to Immigrants from Armenia are Immigrants from Vietnam (96.6%, a difference of 0.020%), Japanese (96.6%, a difference of 0.030%), Central American (96.5%, a difference of 0.050%), Immigrants from Dominican Republic (96.5%, a difference of 0.060%), and Bangladeshi (96.5%, a difference of 0.060%).
| Demographics | Rating | Rank | 1st Grade |
| Vietnamese | 0.0 /100 | #324 | Tragic 96.8% |
| Dominicans | 0.0 /100 | #325 | Tragic 96.7% |
| Indonesians | 0.0 /100 | #326 | Tragic 96.7% |
| Mexicans | 0.0 /100 | #327 | Tragic 96.7% |
| Immigrants | Latin America | 0.0 /100 | #328 | Tragic 96.7% |
| Japanese | 0.0 /100 | #329 | Tragic 96.6% |
| Immigrants | Vietnam | 0.0 /100 | #330 | Tragic 96.6% |
| Immigrants | Armenia | 0.0 /100 | #331 | Tragic 96.6% |
| Central Americans | 0.0 /100 | #332 | Tragic 96.5% |
| Immigrants | Dominican Republic | 0.0 /100 | #333 | Tragic 96.5% |
| Bangladeshis | 0.0 /100 | #334 | Tragic 96.5% |
| Yakama | 0.0 /100 | #335 | Tragic 96.5% |
| Guatemalans | 0.0 /100 | #336 | Tragic 96.5% |
| Immigrants | Cambodia | 0.0 /100 | #337 | Tragic 96.5% |
| Immigrants | Fiji | 0.0 /100 | #338 | Tragic 96.4% |