Swiss vs Immigrants from Guyana Nursery School
COMPARE
Swiss
Immigrants from Guyana
Nursery School
Nursery School Comparison
Swiss
Immigrants from Guyana
98.6%
NURSERY SCHOOL
100.0/ 100
METRIC RATING
35th/ 347
METRIC RANK
96.9%
NURSERY SCHOOL
0.0/ 100
METRIC RATING
318th/ 347
METRIC RANK
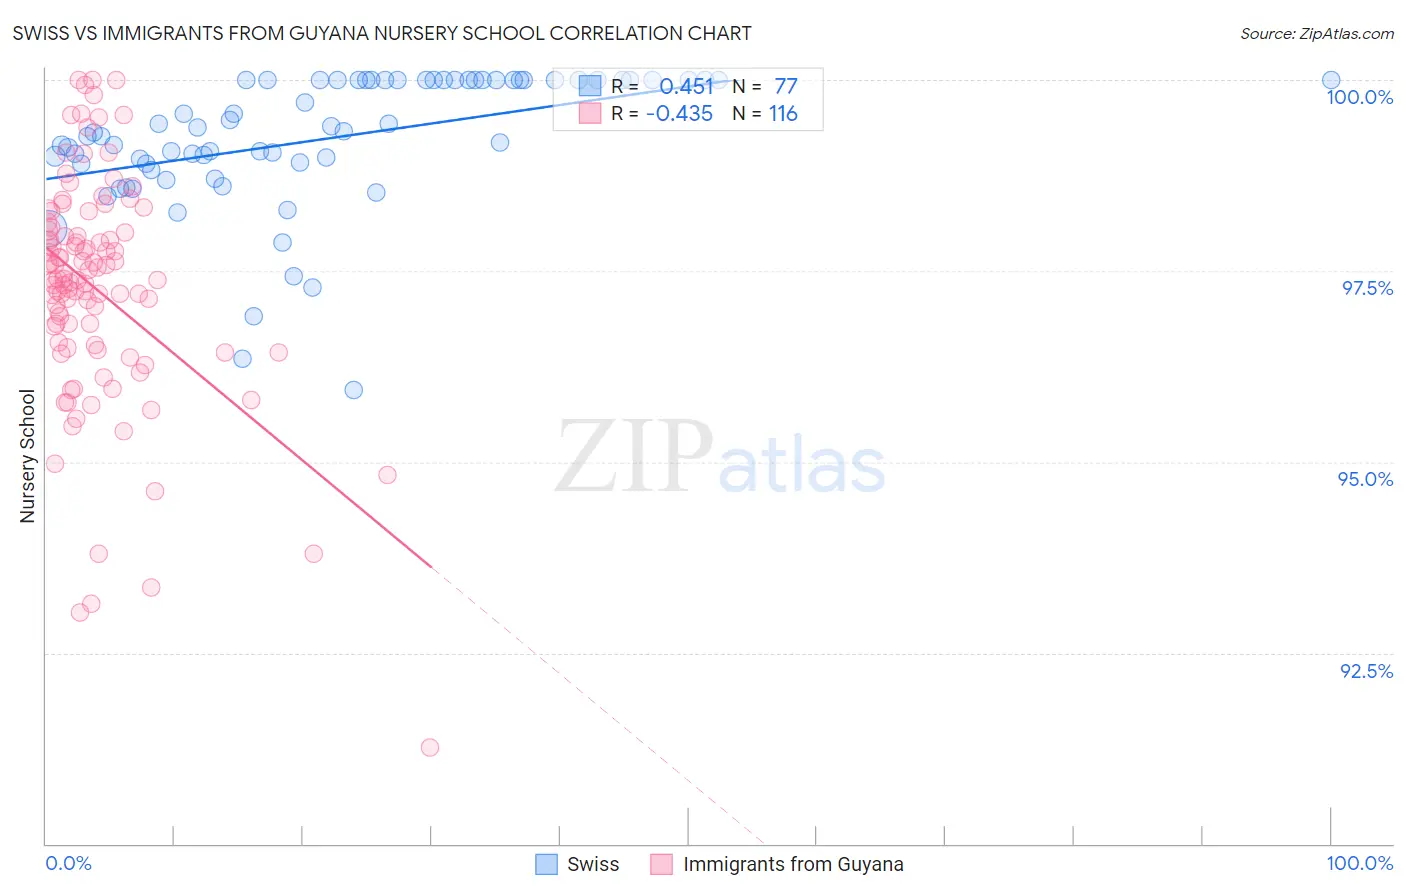
Swiss vs Immigrants from Guyana Nursery School Correlation Chart
The statistical analysis conducted on geographies consisting of 465,023,158 people shows a moderate positive correlation between the proportion of Swiss and percentage of population with at least nursery school education in the United States with a correlation coefficient (R) of 0.451 and weighted average of 98.6%. Similarly, the statistical analysis conducted on geographies consisting of 183,746,342 people shows a moderate negative correlation between the proportion of Immigrants from Guyana and percentage of population with at least nursery school education in the United States with a correlation coefficient (R) of -0.435 and weighted average of 96.9%, a difference of 1.7%.
Nursery School Correlation Summary
| Measurement | Swiss | Immigrants from Guyana |
| Minimum | 95.9% | 91.3% |
| Maximum | 100.0% | 100.0% |
| Range | 4.1% | 8.7% |
| Mean | 99.2% | 97.3% |
| Median | 99.3% | 97.4% |
| Interquartile 25% (IQ1) | 98.9% | 96.5% |
| Interquartile 75% (IQ3) | 100.0% | 98.0% |
| Interquartile Range (IQR) | 1.1% | 1.5% |
| Standard Deviation (Sample) | 0.88% | 1.5% |
| Standard Deviation (Population) | 0.88% | 1.5% |
Similar Demographics by Nursery School
Demographics Similar to Swiss by Nursery School
In terms of nursery school, the demographic groups most similar to Swiss are Chinese (98.6%, a difference of 0.0%), Scandinavian (98.6%, a difference of 0.020%), British (98.5%, a difference of 0.020%), French (98.6%, a difference of 0.030%), and European (98.6%, a difference of 0.030%).
| Demographics | Rating | Rank | Nursery School |
| Croatians | 100.0 /100 | #28 | Exceptional 98.6% |
| French | 100.0 /100 | #29 | Exceptional 98.6% |
| Europeans | 100.0 /100 | #30 | Exceptional 98.6% |
| Czechs | 100.0 /100 | #31 | Exceptional 98.6% |
| French Canadians | 100.0 /100 | #32 | Exceptional 98.6% |
| Scandinavians | 100.0 /100 | #33 | Exceptional 98.6% |
| Chinese | 100.0 /100 | #34 | Exceptional 98.6% |
| Swiss | 100.0 /100 | #35 | Exceptional 98.6% |
| British | 100.0 /100 | #36 | Exceptional 98.5% |
| Lumbee | 99.9 /100 | #37 | Exceptional 98.5% |
| Italians | 99.9 /100 | #38 | Exceptional 98.5% |
| Latvians | 99.9 /100 | #39 | Exceptional 98.5% |
| Chippewa | 99.9 /100 | #40 | Exceptional 98.5% |
| Luxembourgers | 99.9 /100 | #41 | Exceptional 98.5% |
| Eastern Europeans | 99.9 /100 | #42 | Exceptional 98.5% |
Demographics Similar to Immigrants from Guyana by Nursery School
In terms of nursery school, the demographic groups most similar to Immigrants from Guyana are Immigrants from Laos (96.9%, a difference of 0.020%), Immigrants from Burma/Myanmar (96.9%, a difference of 0.020%), Immigrants from Bangladesh (96.9%, a difference of 0.020%), Immigrants from Ecuador (96.9%, a difference of 0.040%), and Mexican American Indian (96.9%, a difference of 0.040%).
| Demographics | Rating | Rank | Nursery School |
| Immigrants | Azores | 0.0 /100 | #311 | Tragic 97.0% |
| Sri Lankans | 0.0 /100 | #312 | Tragic 97.0% |
| Hondurans | 0.0 /100 | #313 | Tragic 97.0% |
| Cape Verdeans | 0.0 /100 | #314 | Tragic 97.0% |
| Immigrants | Nicaragua | 0.0 /100 | #315 | Tragic 96.9% |
| Immigrants | Belize | 0.0 /100 | #316 | Tragic 96.9% |
| Immigrants | Ecuador | 0.0 /100 | #317 | Tragic 96.9% |
| Immigrants | Guyana | 0.0 /100 | #318 | Tragic 96.9% |
| Immigrants | Laos | 0.0 /100 | #319 | Tragic 96.9% |
| Immigrants | Burma/Myanmar | 0.0 /100 | #320 | Tragic 96.9% |
| Immigrants | Bangladesh | 0.0 /100 | #321 | Tragic 96.9% |
| Mexican American Indians | 0.0 /100 | #322 | Tragic 96.9% |
| Immigrants | Honduras | 0.0 /100 | #323 | Tragic 96.9% |
| Vietnamese | 0.0 /100 | #324 | Tragic 96.8% |
| Dominicans | 0.0 /100 | #325 | Tragic 96.8% |