Swiss vs Immigrants from Hungary Nursery School
COMPARE
Swiss
Immigrants from Hungary
Nursery School
Nursery School Comparison
Swiss
Immigrants from Hungary
98.6%
NURSERY SCHOOL
100.0/ 100
METRIC RATING
35th/ 347
METRIC RANK
98.1%
NURSERY SCHOOL
89.3/ 100
METRIC RATING
135th/ 347
METRIC RANK
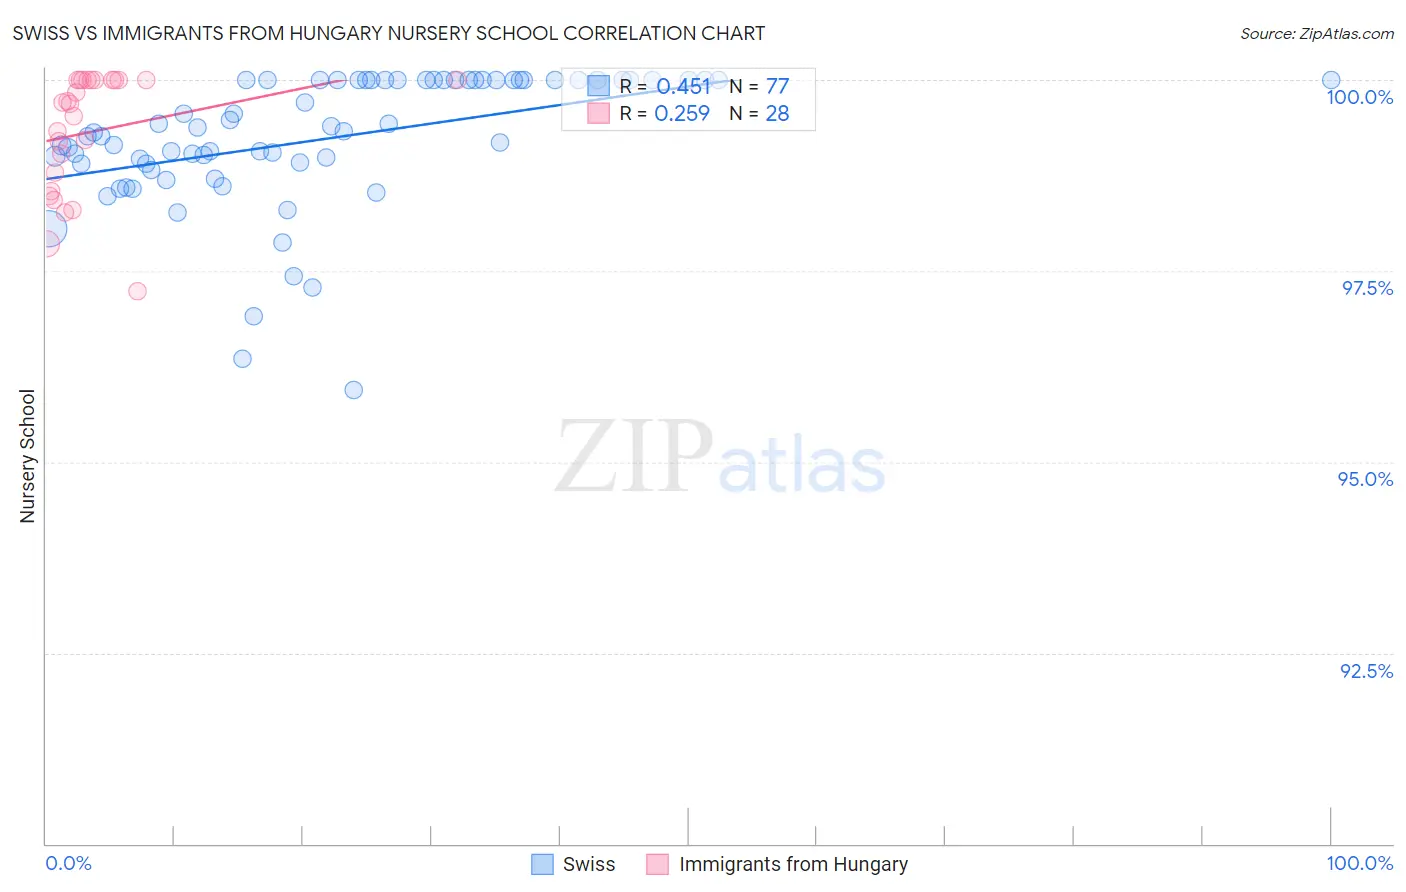
Swiss vs Immigrants from Hungary Nursery School Correlation Chart
The statistical analysis conducted on geographies consisting of 465,023,158 people shows a moderate positive correlation between the proportion of Swiss and percentage of population with at least nursery school education in the United States with a correlation coefficient (R) of 0.451 and weighted average of 98.6%. Similarly, the statistical analysis conducted on geographies consisting of 195,707,305 people shows a weak positive correlation between the proportion of Immigrants from Hungary and percentage of population with at least nursery school education in the United States with a correlation coefficient (R) of 0.259 and weighted average of 98.1%, a difference of 0.43%.
Nursery School Correlation Summary
| Measurement | Swiss | Immigrants from Hungary |
| Minimum | 95.9% | 97.2% |
| Maximum | 100.0% | 100.0% |
| Range | 4.1% | 2.8% |
| Mean | 99.2% | 99.3% |
| Median | 99.3% | 99.7% |
| Interquartile 25% (IQ1) | 98.9% | 98.7% |
| Interquartile 75% (IQ3) | 100.0% | 100.0% |
| Interquartile Range (IQR) | 1.1% | 1.3% |
| Standard Deviation (Sample) | 0.88% | 0.79% |
| Standard Deviation (Population) | 0.88% | 0.78% |
Similar Demographics by Nursery School
Demographics Similar to Swiss by Nursery School
In terms of nursery school, the demographic groups most similar to Swiss are Chinese (98.6%, a difference of 0.0%), Scandinavian (98.6%, a difference of 0.020%), British (98.5%, a difference of 0.020%), French (98.6%, a difference of 0.030%), and European (98.6%, a difference of 0.030%).
| Demographics | Rating | Rank | Nursery School |
| Croatians | 100.0 /100 | #28 | Exceptional 98.6% |
| French | 100.0 /100 | #29 | Exceptional 98.6% |
| Europeans | 100.0 /100 | #30 | Exceptional 98.6% |
| Czechs | 100.0 /100 | #31 | Exceptional 98.6% |
| French Canadians | 100.0 /100 | #32 | Exceptional 98.6% |
| Scandinavians | 100.0 /100 | #33 | Exceptional 98.6% |
| Chinese | 100.0 /100 | #34 | Exceptional 98.6% |
| Swiss | 100.0 /100 | #35 | Exceptional 98.6% |
| British | 100.0 /100 | #36 | Exceptional 98.5% |
| Lumbee | 99.9 /100 | #37 | Exceptional 98.5% |
| Italians | 99.9 /100 | #38 | Exceptional 98.5% |
| Latvians | 99.9 /100 | #39 | Exceptional 98.5% |
| Chippewa | 99.9 /100 | #40 | Exceptional 98.5% |
| Luxembourgers | 99.9 /100 | #41 | Exceptional 98.5% |
| Eastern Europeans | 99.9 /100 | #42 | Exceptional 98.5% |
Demographics Similar to Immigrants from Hungary by Nursery School
In terms of nursery school, the demographic groups most similar to Immigrants from Hungary are Immigrants from Bulgaria (98.1%, a difference of 0.0%), Immigrants from Kuwait (98.1%, a difference of 0.0%), Seminole (98.2%, a difference of 0.010%), Immigrants from Europe (98.1%, a difference of 0.010%), and Israeli (98.1%, a difference of 0.010%).
| Demographics | Rating | Rank | Nursery School |
| Immigrants | Serbia | 92.4 /100 | #128 | Exceptional 98.2% |
| Cambodians | 91.4 /100 | #129 | Exceptional 98.2% |
| Immigrants | Croatia | 91.4 /100 | #130 | Exceptional 98.2% |
| Spaniards | 91.1 /100 | #131 | Exceptional 98.2% |
| Seminole | 90.9 /100 | #132 | Exceptional 98.2% |
| Immigrants | Europe | 90.7 /100 | #133 | Exceptional 98.1% |
| Immigrants | Bulgaria | 89.4 /100 | #134 | Excellent 98.1% |
| Immigrants | Hungary | 89.3 /100 | #135 | Excellent 98.1% |
| Immigrants | Kuwait | 88.9 /100 | #136 | Excellent 98.1% |
| Israelis | 88.2 /100 | #137 | Excellent 98.1% |
| Immigrants | Romania | 88.0 /100 | #138 | Excellent 98.1% |
| Blackfeet | 87.5 /100 | #139 | Excellent 98.1% |
| Palestinians | 83.7 /100 | #140 | Excellent 98.1% |
| Immigrants | Turkey | 83.0 /100 | #141 | Excellent 98.1% |
| Burmese | 81.7 /100 | #142 | Excellent 98.1% |