Swedish vs South American Indian No Schooling Completed
COMPARE
Swedish
South American Indian
No Schooling Completed
No Schooling Completed Comparison
Swedes
South American Indians
1.4%
NO SCHOOLING COMPLETED
100.0/ 100
METRIC RATING
8th/ 347
METRIC RANK
2.2%
NO SCHOOLING COMPLETED
11.0/ 100
METRIC RATING
207th/ 347
METRIC RANK
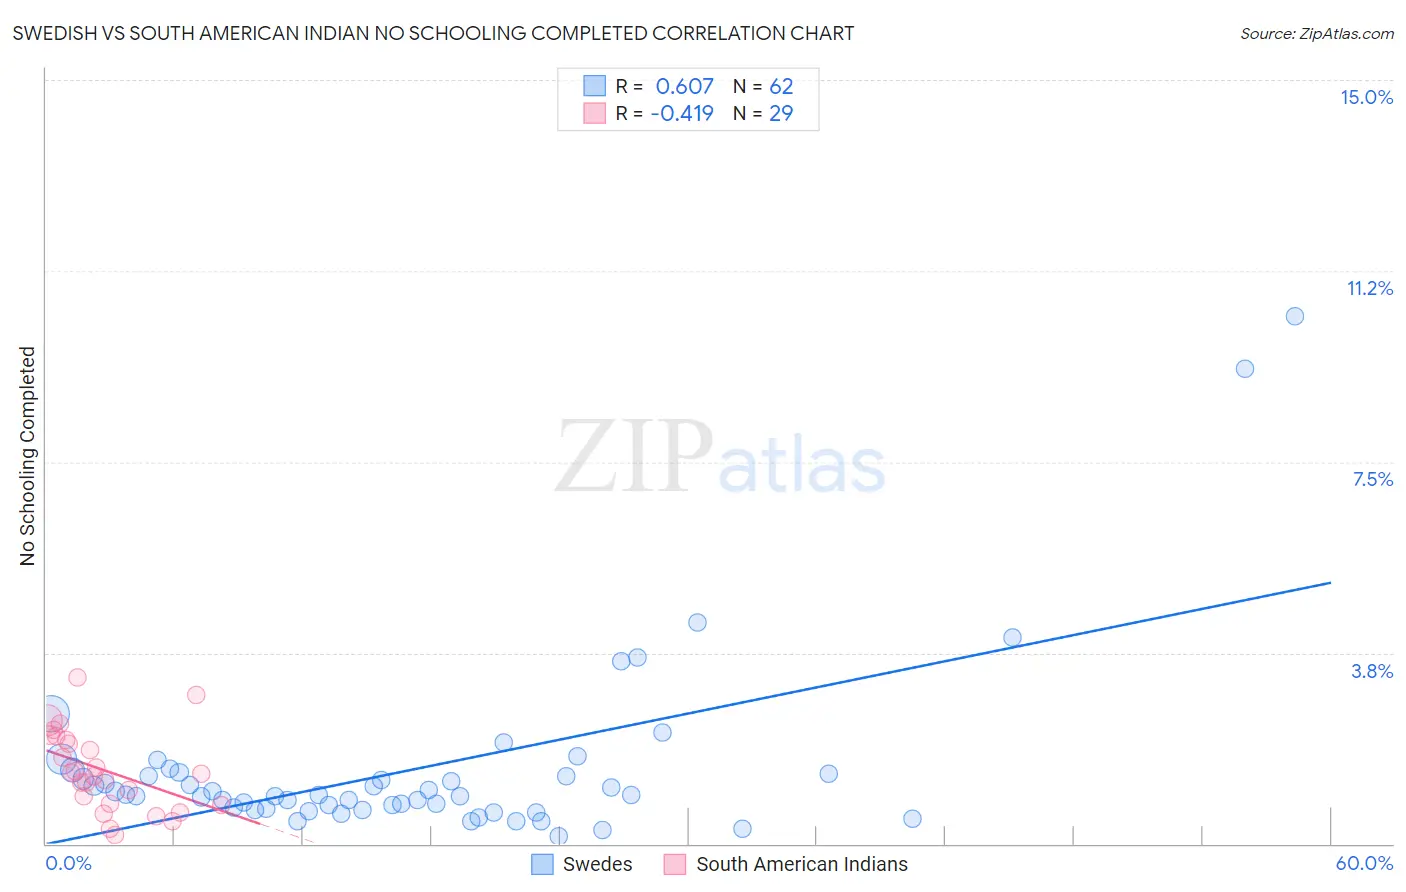
Swedish vs South American Indian No Schooling Completed Correlation Chart
The statistical analysis conducted on geographies consisting of 523,541,764 people shows a significant positive correlation between the proportion of Swedes and percentage of population with no schooling in the United States with a correlation coefficient (R) of 0.607 and weighted average of 1.4%. Similarly, the statistical analysis conducted on geographies consisting of 164,141,114 people shows a moderate negative correlation between the proportion of South American Indians and percentage of population with no schooling in the United States with a correlation coefficient (R) of -0.419 and weighted average of 2.2%, a difference of 59.2%.
No Schooling Completed Correlation Summary
| Measurement | Swedish | South American Indian |
| Minimum | 0.14% | 0.17% |
| Maximum | 10.4% | 3.3% |
| Range | 10.2% | 3.1% |
| Mean | 1.5% | 1.4% |
| Median | 0.96% | 1.4% |
| Interquartile 25% (IQ1) | 0.69% | 0.77% |
| Interquartile 75% (IQ3) | 1.4% | 2.1% |
| Interquartile Range (IQR) | 0.68% | 1.3% |
| Standard Deviation (Sample) | 1.8% | 0.79% |
| Standard Deviation (Population) | 1.8% | 0.78% |
Similar Demographics by No Schooling Completed
Demographics Similar to Swedes by No Schooling Completed
In terms of no schooling completed, the demographic groups most similar to Swedes are Scottish (1.4%, a difference of 0.53%), Dutch (1.4%, a difference of 1.3%), English (1.4%, a difference of 1.5%), Lithuanian (1.4%, a difference of 2.2%), and Irish (1.4%, a difference of 2.2%).
| Demographics | Rating | Rank | No Schooling Completed |
| Yup'ik | 100.0 /100 | #1 | Exceptional 1.2% |
| Slovaks | 100.0 /100 | #2 | Exceptional 1.3% |
| Norwegians | 100.0 /100 | #3 | Exceptional 1.3% |
| Germans | 100.0 /100 | #4 | Exceptional 1.4% |
| Slovenes | 100.0 /100 | #5 | Exceptional 1.4% |
| Carpatho Rusyns | 100.0 /100 | #6 | Exceptional 1.4% |
| English | 100.0 /100 | #7 | Exceptional 1.4% |
| Swedes | 100.0 /100 | #8 | Exceptional 1.4% |
| Scottish | 100.0 /100 | #9 | Exceptional 1.4% |
| Dutch | 100.0 /100 | #10 | Exceptional 1.4% |
| Lithuanians | 100.0 /100 | #11 | Exceptional 1.4% |
| Irish | 100.0 /100 | #12 | Exceptional 1.4% |
| Poles | 100.0 /100 | #13 | Exceptional 1.4% |
| Scotch-Irish | 100.0 /100 | #14 | Exceptional 1.5% |
| Tlingit-Haida | 100.0 /100 | #15 | Exceptional 1.5% |
Demographics Similar to South American Indians by No Schooling Completed
In terms of no schooling completed, the demographic groups most similar to South American Indians are Uruguayan (2.2%, a difference of 0.0%), Bahamian (2.2%, a difference of 0.18%), Immigrants from Bahamas (2.2%, a difference of 0.19%), Immigrants from Oceania (2.2%, a difference of 0.26%), and Native/Alaskan (2.2%, a difference of 0.33%).
| Demographics | Rating | Rank | No Schooling Completed |
| Immigrants | Northern Africa | 19.5 /100 | #200 | Poor 2.2% |
| Costa Ricans | 17.1 /100 | #201 | Poor 2.2% |
| Moroccans | 13.7 /100 | #202 | Poor 2.2% |
| Laotians | 13.3 /100 | #203 | Poor 2.2% |
| Hopi | 12.9 /100 | #204 | Poor 2.2% |
| Immigrants | Bahamas | 11.6 /100 | #205 | Poor 2.2% |
| Bahamians | 11.6 /100 | #206 | Poor 2.2% |
| South American Indians | 11.0 /100 | #207 | Poor 2.2% |
| Uruguayans | 11.0 /100 | #208 | Poor 2.2% |
| Immigrants | Oceania | 10.2 /100 | #209 | Poor 2.2% |
| Natives/Alaskans | 10.0 /100 | #210 | Tragic 2.2% |
| Immigrants | Panama | 8.8 /100 | #211 | Tragic 2.3% |
| Immigrants | Morocco | 8.7 /100 | #212 | Tragic 2.3% |
| Ute | 8.2 /100 | #213 | Tragic 2.3% |
| Samoans | 8.2 /100 | #214 | Tragic 2.3% |