Immigrants from Czechoslovakia vs South American Indian No Schooling Completed
COMPARE
Immigrants from Czechoslovakia
South American Indian
No Schooling Completed
No Schooling Completed Comparison
Immigrants from Czechoslovakia
South American Indians
1.8%
NO SCHOOLING COMPLETED
97.9/ 100
METRIC RATING
101st/ 347
METRIC RANK
2.2%
NO SCHOOLING COMPLETED
11.0/ 100
METRIC RATING
207th/ 347
METRIC RANK
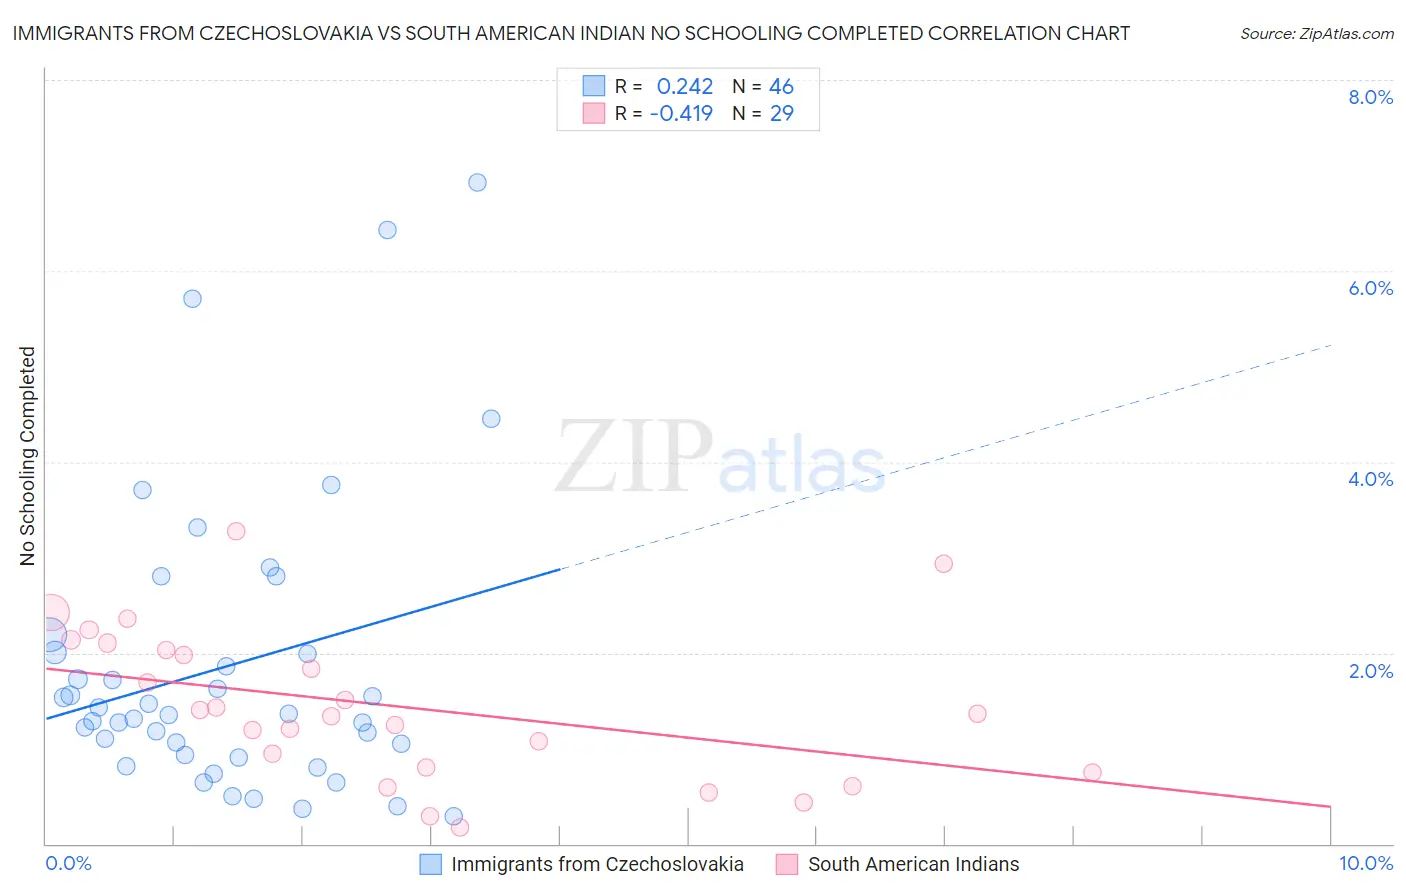
Immigrants from Czechoslovakia vs South American Indian No Schooling Completed Correlation Chart
The statistical analysis conducted on geographies consisting of 194,474,881 people shows a weak positive correlation between the proportion of Immigrants from Czechoslovakia and percentage of population with no schooling in the United States with a correlation coefficient (R) of 0.242 and weighted average of 1.8%. Similarly, the statistical analysis conducted on geographies consisting of 164,141,114 people shows a moderate negative correlation between the proportion of South American Indians and percentage of population with no schooling in the United States with a correlation coefficient (R) of -0.419 and weighted average of 2.2%, a difference of 22.9%.
No Schooling Completed Correlation Summary
| Measurement | Immigrants from Czechoslovakia | South American Indian |
| Minimum | 0.29% | 0.17% |
| Maximum | 6.9% | 3.3% |
| Range | 6.6% | 3.1% |
| Mean | 1.9% | 1.4% |
| Median | 1.4% | 1.4% |
| Interquartile 25% (IQ1) | 0.93% | 0.77% |
| Interquartile 75% (IQ3) | 2.0% | 2.1% |
| Interquartile Range (IQR) | 1.1% | 1.3% |
| Standard Deviation (Sample) | 1.5% | 0.79% |
| Standard Deviation (Population) | 1.5% | 0.78% |
Similar Demographics by No Schooling Completed
Demographics Similar to Immigrants from Czechoslovakia by No Schooling Completed
In terms of no schooling completed, the demographic groups most similar to Immigrants from Czechoslovakia are Immigrants from Switzerland (1.8%, a difference of 0.0%), Basque (1.8%, a difference of 0.060%), Immigrants from Singapore (1.8%, a difference of 0.30%), Choctaw (1.8%, a difference of 0.49%), and Thai (1.8%, a difference of 0.63%).
| Demographics | Rating | Rank | No Schooling Completed |
| Immigrants | Nonimmigrants | 98.5 /100 | #94 | Exceptional 1.8% |
| Puget Sound Salish | 98.5 /100 | #95 | Exceptional 1.8% |
| Bhutanese | 98.4 /100 | #96 | Exceptional 1.8% |
| Immigrants | Ireland | 98.4 /100 | #97 | Exceptional 1.8% |
| Iranians | 98.2 /100 | #98 | Exceptional 1.8% |
| Choctaw | 98.1 /100 | #99 | Exceptional 1.8% |
| Immigrants | Singapore | 98.0 /100 | #100 | Exceptional 1.8% |
| Immigrants | Czechoslovakia | 97.9 /100 | #101 | Exceptional 1.8% |
| Immigrants | Switzerland | 97.9 /100 | #102 | Exceptional 1.8% |
| Basques | 97.9 /100 | #103 | Exceptional 1.8% |
| Thais | 97.5 /100 | #104 | Exceptional 1.8% |
| German Russians | 97.5 /100 | #105 | Exceptional 1.8% |
| Immigrants | France | 97.3 /100 | #106 | Exceptional 1.8% |
| Yugoslavians | 97.2 /100 | #107 | Exceptional 1.8% |
| Okinawans | 97.1 /100 | #108 | Exceptional 1.8% |
Demographics Similar to South American Indians by No Schooling Completed
In terms of no schooling completed, the demographic groups most similar to South American Indians are Uruguayan (2.2%, a difference of 0.0%), Bahamian (2.2%, a difference of 0.18%), Immigrants from Bahamas (2.2%, a difference of 0.19%), Immigrants from Oceania (2.2%, a difference of 0.26%), and Native/Alaskan (2.2%, a difference of 0.33%).
| Demographics | Rating | Rank | No Schooling Completed |
| Immigrants | Northern Africa | 19.5 /100 | #200 | Poor 2.2% |
| Costa Ricans | 17.1 /100 | #201 | Poor 2.2% |
| Moroccans | 13.7 /100 | #202 | Poor 2.2% |
| Laotians | 13.3 /100 | #203 | Poor 2.2% |
| Hopi | 12.9 /100 | #204 | Poor 2.2% |
| Immigrants | Bahamas | 11.6 /100 | #205 | Poor 2.2% |
| Bahamians | 11.6 /100 | #206 | Poor 2.2% |
| South American Indians | 11.0 /100 | #207 | Poor 2.2% |
| Uruguayans | 11.0 /100 | #208 | Poor 2.2% |
| Immigrants | Oceania | 10.2 /100 | #209 | Poor 2.2% |
| Natives/Alaskans | 10.0 /100 | #210 | Tragic 2.2% |
| Immigrants | Panama | 8.8 /100 | #211 | Tragic 2.3% |
| Immigrants | Morocco | 8.7 /100 | #212 | Tragic 2.3% |
| Ute | 8.2 /100 | #213 | Tragic 2.3% |
| Samoans | 8.2 /100 | #214 | Tragic 2.3% |