Swedish vs Cape Verdean No Schooling Completed
COMPARE
Swedish
Cape Verdean
No Schooling Completed
No Schooling Completed Comparison
Swedes
Cape Verdeans
1.4%
NO SCHOOLING COMPLETED
100.0/ 100
METRIC RATING
8th/ 347
METRIC RANK
3.1%
NO SCHOOLING COMPLETED
0.0/ 100
METRIC RATING
317th/ 347
METRIC RANK
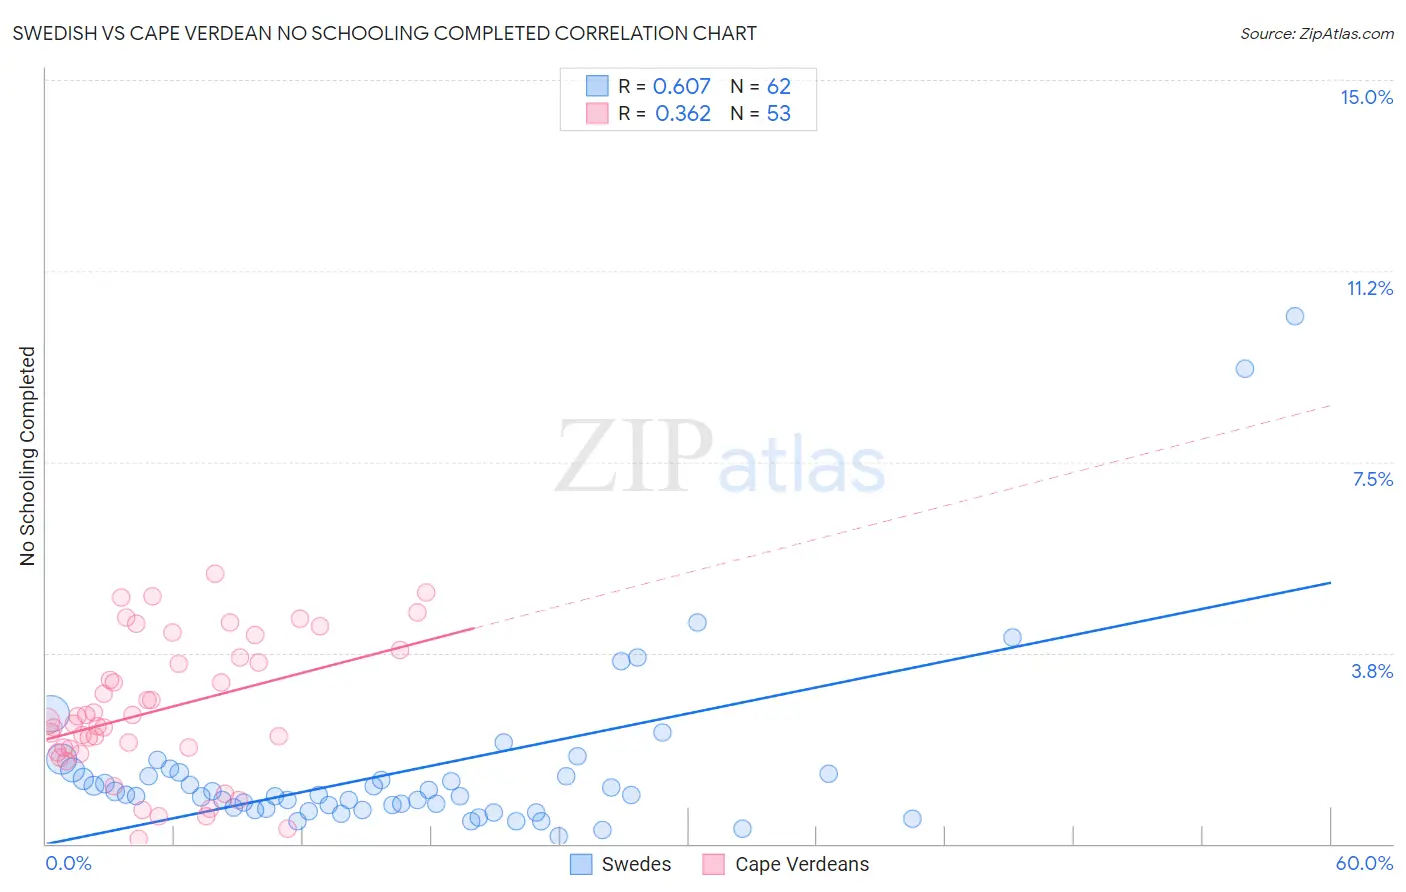
Swedish vs Cape Verdean No Schooling Completed Correlation Chart
The statistical analysis conducted on geographies consisting of 523,541,764 people shows a significant positive correlation between the proportion of Swedes and percentage of population with no schooling in the United States with a correlation coefficient (R) of 0.607 and weighted average of 1.4%. Similarly, the statistical analysis conducted on geographies consisting of 107,247,027 people shows a mild positive correlation between the proportion of Cape Verdeans and percentage of population with no schooling in the United States with a correlation coefficient (R) of 0.362 and weighted average of 3.1%, a difference of 120.4%.
No Schooling Completed Correlation Summary
| Measurement | Swedish | Cape Verdean |
| Minimum | 0.14% | 0.088% |
| Maximum | 10.4% | 5.3% |
| Range | 10.2% | 5.2% |
| Mean | 1.5% | 2.6% |
| Median | 0.96% | 2.4% |
| Interquartile 25% (IQ1) | 0.69% | 1.8% |
| Interquartile 75% (IQ3) | 1.4% | 3.7% |
| Interquartile Range (IQR) | 0.68% | 1.9% |
| Standard Deviation (Sample) | 1.8% | 1.3% |
| Standard Deviation (Population) | 1.8% | 1.3% |
Similar Demographics by No Schooling Completed
Demographics Similar to Swedes by No Schooling Completed
In terms of no schooling completed, the demographic groups most similar to Swedes are Scottish (1.4%, a difference of 0.53%), Dutch (1.4%, a difference of 1.3%), English (1.4%, a difference of 1.5%), Lithuanian (1.4%, a difference of 2.2%), and Irish (1.4%, a difference of 2.2%).
| Demographics | Rating | Rank | No Schooling Completed |
| Yup'ik | 100.0 /100 | #1 | Exceptional 1.2% |
| Slovaks | 100.0 /100 | #2 | Exceptional 1.3% |
| Norwegians | 100.0 /100 | #3 | Exceptional 1.3% |
| Germans | 100.0 /100 | #4 | Exceptional 1.4% |
| Slovenes | 100.0 /100 | #5 | Exceptional 1.4% |
| Carpatho Rusyns | 100.0 /100 | #6 | Exceptional 1.4% |
| English | 100.0 /100 | #7 | Exceptional 1.4% |
| Swedes | 100.0 /100 | #8 | Exceptional 1.4% |
| Scottish | 100.0 /100 | #9 | Exceptional 1.4% |
| Dutch | 100.0 /100 | #10 | Exceptional 1.4% |
| Lithuanians | 100.0 /100 | #11 | Exceptional 1.4% |
| Irish | 100.0 /100 | #12 | Exceptional 1.4% |
| Poles | 100.0 /100 | #13 | Exceptional 1.4% |
| Scotch-Irish | 100.0 /100 | #14 | Exceptional 1.5% |
| Tlingit-Haida | 100.0 /100 | #15 | Exceptional 1.5% |
Demographics Similar to Cape Verdeans by No Schooling Completed
In terms of no schooling completed, the demographic groups most similar to Cape Verdeans are Immigrants from Ecuador (3.1%, a difference of 0.49%), Immigrants from Guyana (3.1%, a difference of 0.68%), Immigrants from Nicaragua (3.1%, a difference of 0.84%), Immigrants from Belize (3.1%, a difference of 1.1%), and Honduran (3.1%, a difference of 1.2%).
| Demographics | Rating | Rank | No Schooling Completed |
| Guyanese | 0.0 /100 | #310 | Tragic 3.0% |
| Immigrants | Azores | 0.0 /100 | #311 | Tragic 3.0% |
| Sri Lankans | 0.0 /100 | #312 | Tragic 3.0% |
| Hondurans | 0.0 /100 | #313 | Tragic 3.1% |
| Immigrants | Belize | 0.0 /100 | #314 | Tragic 3.1% |
| Immigrants | Nicaragua | 0.0 /100 | #315 | Tragic 3.1% |
| Immigrants | Ecuador | 0.0 /100 | #316 | Tragic 3.1% |
| Cape Verdeans | 0.0 /100 | #317 | Tragic 3.1% |
| Immigrants | Guyana | 0.0 /100 | #318 | Tragic 3.1% |
| Immigrants | Burma/Myanmar | 0.0 /100 | #319 | Tragic 3.1% |
| Immigrants | Bangladesh | 0.0 /100 | #320 | Tragic 3.1% |
| Immigrants | Laos | 0.0 /100 | #321 | Tragic 3.1% |
| Immigrants | Honduras | 0.0 /100 | #322 | Tragic 3.2% |
| Vietnamese | 0.0 /100 | #323 | Tragic 3.2% |
| Mexican American Indians | 0.0 /100 | #324 | Tragic 3.2% |