Sudanese vs Slovene In Labor Force | Age 16-19
COMPARE
Sudanese
Slovene
In Labor Force | Age 16-19
In Labor Force | Age 16-19 Comparison
Sudanese
Slovenes
42.9%
IN LABOR FORCE | AGE 16-19
100.0/ 100
METRIC RATING
22nd/ 347
METRIC RANK
43.7%
IN LABOR FORCE | AGE 16-19
100.0/ 100
METRIC RATING
15th/ 347
METRIC RANK
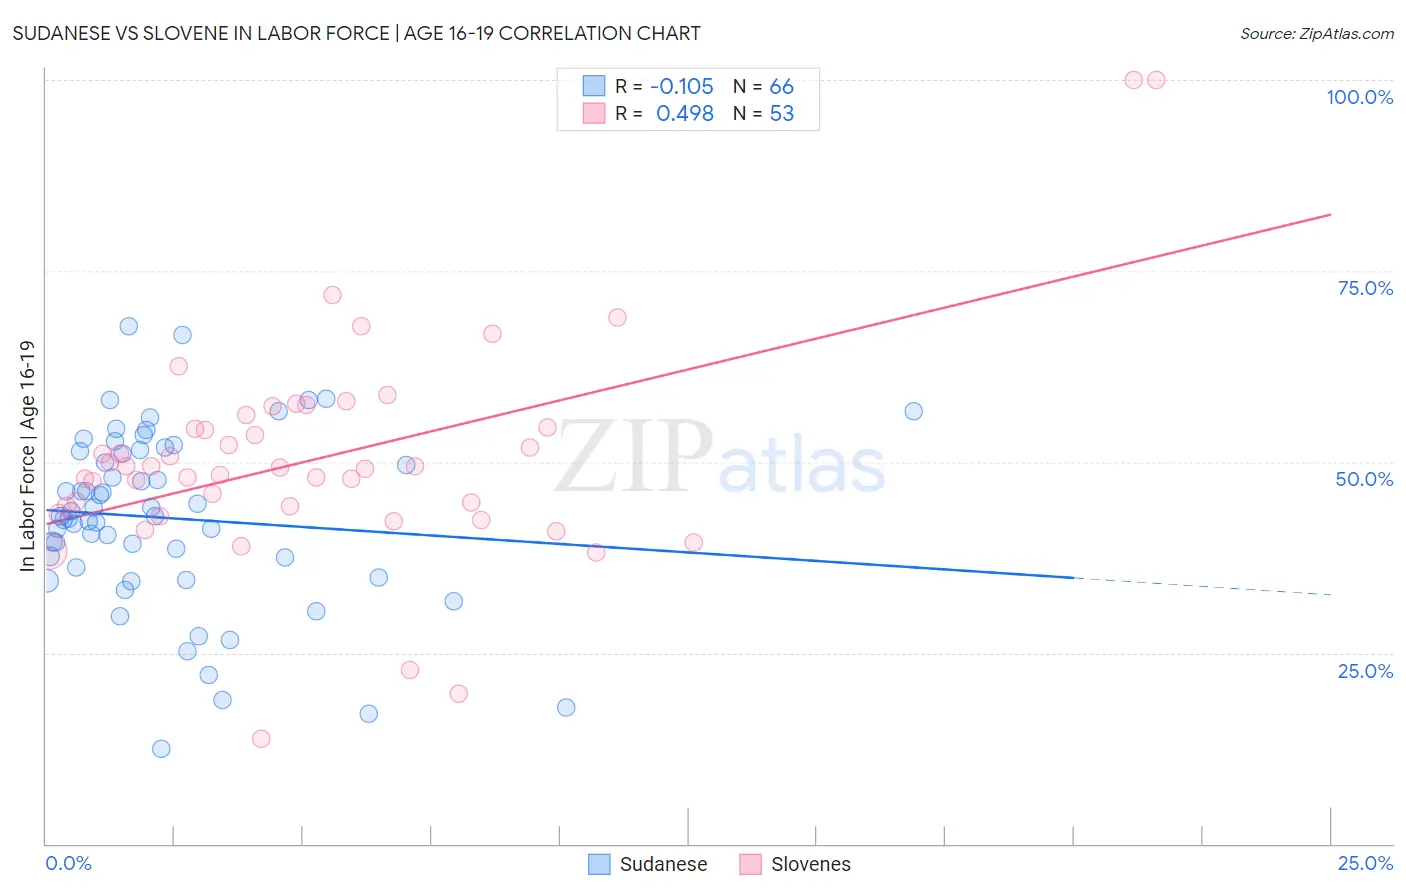
Sudanese vs Slovene In Labor Force | Age 16-19 Correlation Chart
The statistical analysis conducted on geographies consisting of 110,142,178 people shows a poor negative correlation between the proportion of Sudanese and labor force participation rate among population between the ages 16 and 19 in the United States with a correlation coefficient (R) of -0.105 and weighted average of 42.9%. Similarly, the statistical analysis conducted on geographies consisting of 261,051,776 people shows a moderate positive correlation between the proportion of Slovenes and labor force participation rate among population between the ages 16 and 19 in the United States with a correlation coefficient (R) of 0.498 and weighted average of 43.7%, a difference of 1.9%.
In Labor Force | Age 16-19 Correlation Summary
| Measurement | Sudanese | Slovene |
| Minimum | 12.5% | 13.8% |
| Maximum | 67.8% | 100.0% |
| Range | 55.3% | 86.2% |
| Mean | 42.6% | 50.5% |
| Median | 42.8% | 49.2% |
| Interquartile 25% (IQ1) | 36.1% | 43.7% |
| Interquartile 75% (IQ3) | 51.4% | 55.3% |
| Interquartile Range (IQR) | 15.3% | 11.6% |
| Standard Deviation (Sample) | 11.5% | 14.6% |
| Standard Deviation (Population) | 11.4% | 14.4% |
Demographics Similar to Sudanese and Slovenes by In Labor Force | Age 16-19
In terms of in labor force | age 16-19, the demographic groups most similar to Sudanese are Ottawa (43.0%, a difference of 0.40%), Slovak (42.6%, a difference of 0.59%), Bangladeshi (42.5%, a difference of 0.92%), Swiss (43.3%, a difference of 0.96%), and German Russian (42.4%, a difference of 1.0%). Similarly, the demographic groups most similar to Slovenes are Czech (43.6%, a difference of 0.11%), Scandinavian (43.6%, a difference of 0.17%), French Canadian (43.6%, a difference of 0.25%), Chippewa (43.8%, a difference of 0.26%), and Dutch (43.8%, a difference of 0.36%).
| Demographics | Rating | Rank | In Labor Force | Age 16-19 |
| Immigrants | Cabo Verde | 100.0 /100 | #8 | Exceptional 44.7% |
| Cape Verdeans | 100.0 /100 | #9 | Exceptional 44.5% |
| Germans | 100.0 /100 | #10 | Exceptional 44.2% |
| Swedes | 100.0 /100 | #11 | Exceptional 44.1% |
| Finns | 100.0 /100 | #12 | Exceptional 43.9% |
| Dutch | 100.0 /100 | #13 | Exceptional 43.8% |
| Chippewa | 100.0 /100 | #14 | Exceptional 43.8% |
| Slovenes | 100.0 /100 | #15 | Exceptional 43.7% |
| Czechs | 100.0 /100 | #16 | Exceptional 43.6% |
| Scandinavians | 100.0 /100 | #17 | Exceptional 43.6% |
| French Canadians | 100.0 /100 | #18 | Exceptional 43.6% |
| Belgians | 100.0 /100 | #19 | Exceptional 43.4% |
| Swiss | 100.0 /100 | #20 | Exceptional 43.3% |
| Ottawa | 100.0 /100 | #21 | Exceptional 43.0% |
| Sudanese | 100.0 /100 | #22 | Exceptional 42.9% |
| Slovaks | 100.0 /100 | #23 | Exceptional 42.6% |
| Bangladeshis | 100.0 /100 | #24 | Exceptional 42.5% |
| German Russians | 100.0 /100 | #25 | Exceptional 42.4% |
| English | 100.0 /100 | #26 | Exceptional 42.4% |
| Welsh | 100.0 /100 | #27 | Exceptional 42.3% |
| Poles | 100.0 /100 | #28 | Exceptional 42.1% |