Immigrants from Laos vs Immigrants from Turkey Master's Degree
COMPARE
Immigrants from Laos
Immigrants from Turkey
Master's Degree
Master's Degree Comparison
Immigrants from Laos
Immigrants from Turkey
11.4%
MASTER'S DEGREE
0.1/ 100
METRIC RATING
303rd/ 347
METRIC RANK
19.7%
MASTER'S DEGREE
100.0/ 100
METRIC RATING
30th/ 347
METRIC RANK
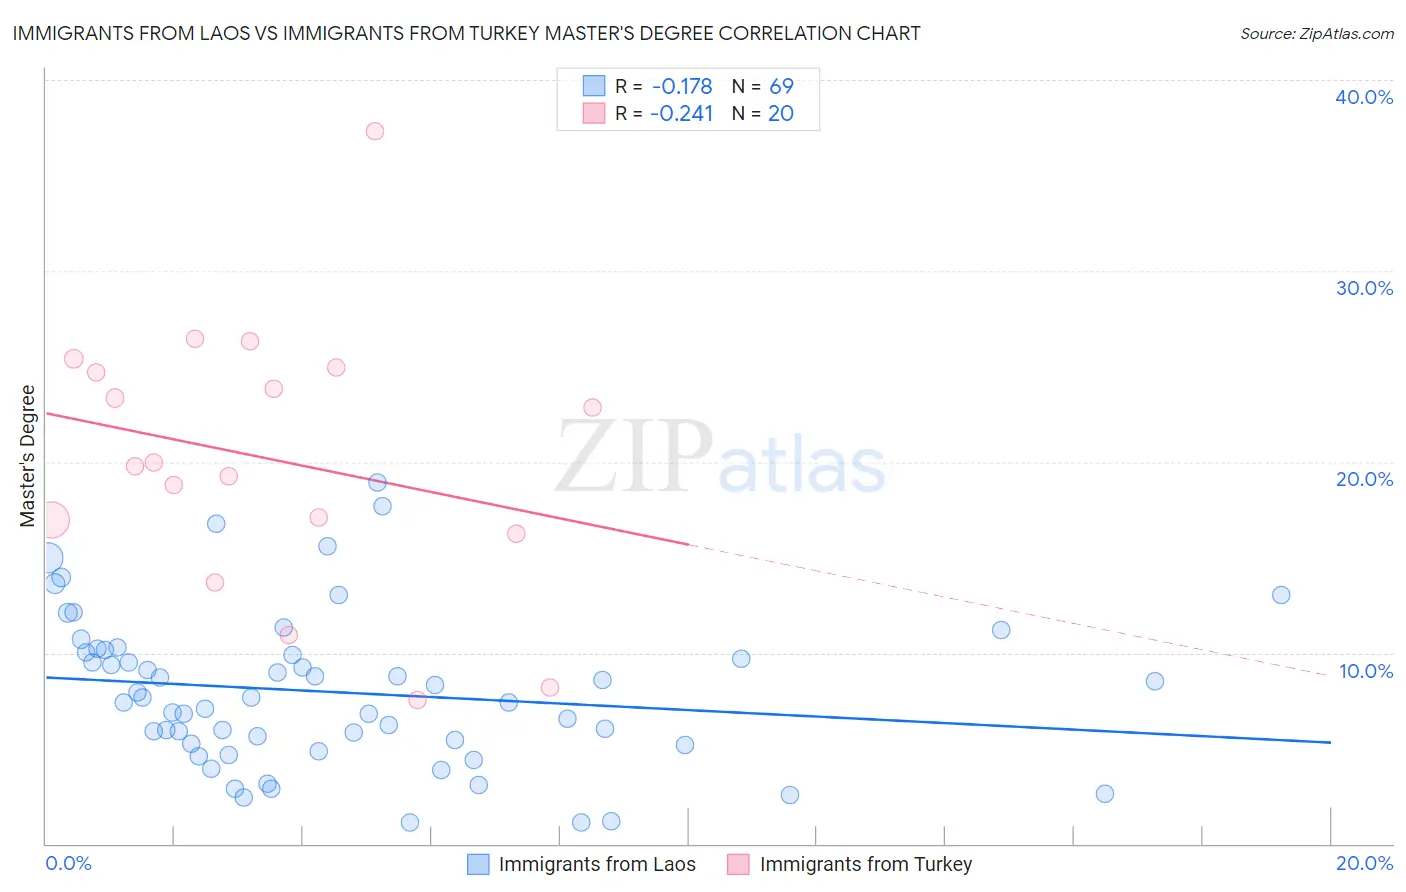
Immigrants from Laos vs Immigrants from Turkey Master's Degree Correlation Chart
The statistical analysis conducted on geographies consisting of 201,443,895 people shows a poor negative correlation between the proportion of Immigrants from Laos and percentage of population with at least master's degree education in the United States with a correlation coefficient (R) of -0.178 and weighted average of 11.4%. Similarly, the statistical analysis conducted on geographies consisting of 223,018,840 people shows a weak negative correlation between the proportion of Immigrants from Turkey and percentage of population with at least master's degree education in the United States with a correlation coefficient (R) of -0.241 and weighted average of 19.7%, a difference of 73.5%.
Master's Degree Correlation Summary
| Measurement | Immigrants from Laos | Immigrants from Turkey |
| Minimum | 1.1% | 7.6% |
| Maximum | 18.9% | 37.3% |
| Range | 17.8% | 29.8% |
| Mean | 7.9% | 20.2% |
| Median | 7.7% | 19.9% |
| Interquartile 25% (IQ1) | 5.2% | 16.6% |
| Interquartile 75% (IQ3) | 10.1% | 24.8% |
| Interquartile Range (IQR) | 4.9% | 8.2% |
| Standard Deviation (Sample) | 4.0% | 7.0% |
| Standard Deviation (Population) | 4.0% | 6.9% |
Similar Demographics by Master's Degree
Demographics Similar to Immigrants from Laos by Master's Degree
In terms of master's degree, the demographic groups most similar to Immigrants from Laos are Cherokee (11.4%, a difference of 0.020%), Immigrants from Cabo Verde (11.3%, a difference of 0.19%), Tsimshian (11.4%, a difference of 0.33%), Chippewa (11.4%, a difference of 0.49%), and Chickasaw (11.4%, a difference of 0.51%).
| Demographics | Rating | Rank | Master's Degree |
| Alaskan Athabascans | 0.1 /100 | #296 | Tragic 11.6% |
| Immigrants | Yemen | 0.1 /100 | #297 | Tragic 11.6% |
| Samoans | 0.1 /100 | #298 | Tragic 11.5% |
| Chickasaw | 0.1 /100 | #299 | Tragic 11.4% |
| Chippewa | 0.1 /100 | #300 | Tragic 11.4% |
| Tsimshian | 0.1 /100 | #301 | Tragic 11.4% |
| Cherokee | 0.1 /100 | #302 | Tragic 11.4% |
| Immigrants | Laos | 0.1 /100 | #303 | Tragic 11.4% |
| Immigrants | Cabo Verde | 0.1 /100 | #304 | Tragic 11.3% |
| Immigrants | Latin America | 0.0 /100 | #305 | Tragic 11.3% |
| Mexican American Indians | 0.0 /100 | #306 | Tragic 11.2% |
| Cheyenne | 0.0 /100 | #307 | Tragic 11.2% |
| Puerto Ricans | 0.0 /100 | #308 | Tragic 11.2% |
| Puget Sound Salish | 0.0 /100 | #309 | Tragic 11.1% |
| Shoshone | 0.0 /100 | #310 | Tragic 11.1% |
Demographics Similar to Immigrants from Turkey by Master's Degree
In terms of master's degree, the demographic groups most similar to Immigrants from Turkey are Immigrants from Korea (19.7%, a difference of 0.010%), Burmese (19.7%, a difference of 0.080%), Latvian (19.8%, a difference of 0.50%), Russian (19.5%, a difference of 0.86%), and Immigrants from Denmark (19.5%, a difference of 0.89%).
| Demographics | Rating | Rank | Master's Degree |
| Immigrants | France | 100.0 /100 | #23 | Exceptional 20.3% |
| Immigrants | Sweden | 100.0 /100 | #24 | Exceptional 20.3% |
| Immigrants | Japan | 100.0 /100 | #25 | Exceptional 20.0% |
| Cambodians | 100.0 /100 | #26 | Exceptional 20.0% |
| Immigrants | Sri Lanka | 100.0 /100 | #27 | Exceptional 19.9% |
| Turks | 100.0 /100 | #28 | Exceptional 19.9% |
| Latvians | 100.0 /100 | #29 | Exceptional 19.8% |
| Immigrants | Turkey | 100.0 /100 | #30 | Exceptional 19.7% |
| Immigrants | Korea | 100.0 /100 | #31 | Exceptional 19.7% |
| Burmese | 100.0 /100 | #32 | Exceptional 19.7% |
| Russians | 100.0 /100 | #33 | Exceptional 19.5% |
| Immigrants | Denmark | 100.0 /100 | #34 | Exceptional 19.5% |
| Immigrants | Northern Europe | 100.0 /100 | #35 | Exceptional 19.5% |
| Immigrants | Russia | 100.0 /100 | #36 | Exceptional 19.4% |
| Mongolians | 100.0 /100 | #37 | Exceptional 19.4% |