Jamaican vs Immigrants from India 2nd Grade
COMPARE
Jamaican
Immigrants from India
2nd Grade
2nd Grade Comparison
Jamaicans
Immigrants from India
97.5%
2ND GRADE
0.6/ 100
METRIC RATING
256th/ 347
METRIC RANK
98.2%
2ND GRADE
98.8/ 100
METRIC RATING
93rd/ 347
METRIC RANK
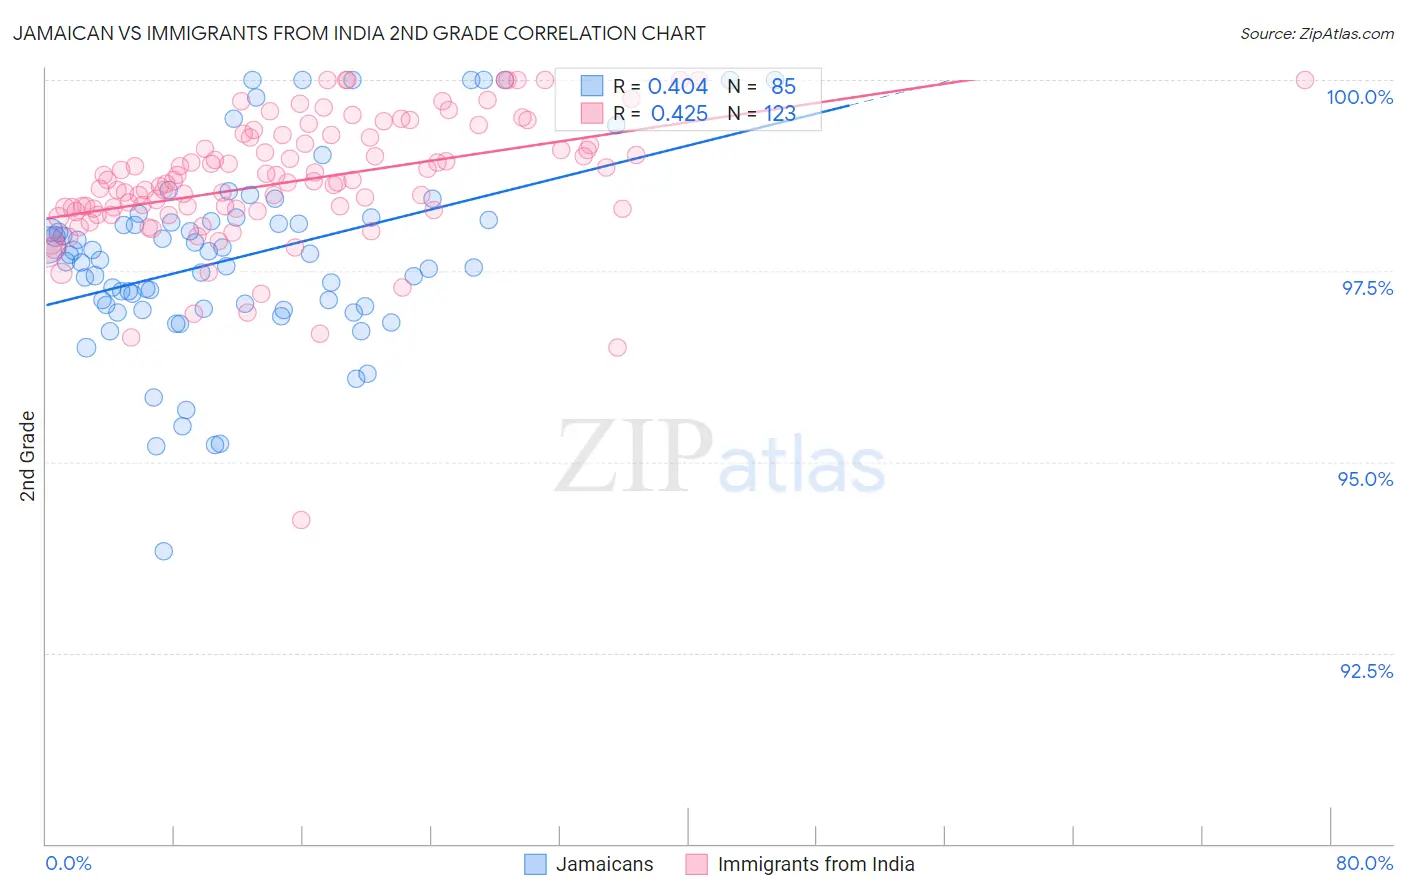
Jamaican vs Immigrants from India 2nd Grade Correlation Chart
The statistical analysis conducted on geographies consisting of 368,084,732 people shows a moderate positive correlation between the proportion of Jamaicans and percentage of population with at least 2nd grade education in the United States with a correlation coefficient (R) of 0.404 and weighted average of 97.5%. Similarly, the statistical analysis conducted on geographies consisting of 434,105,844 people shows a moderate positive correlation between the proportion of Immigrants from India and percentage of population with at least 2nd grade education in the United States with a correlation coefficient (R) of 0.425 and weighted average of 98.2%, a difference of 0.76%.
2nd Grade Correlation Summary
| Measurement | Jamaican | Immigrants from India |
| Minimum | 93.8% | 94.2% |
| Maximum | 100.0% | 100.0% |
| Range | 6.2% | 5.8% |
| Mean | 97.7% | 98.7% |
| Median | 97.7% | 98.7% |
| Interquartile 25% (IQ1) | 97.0% | 98.3% |
| Interquartile 75% (IQ3) | 98.2% | 99.2% |
| Interquartile Range (IQR) | 1.1% | 0.96% |
| Standard Deviation (Sample) | 1.2% | 0.86% |
| Standard Deviation (Population) | 1.2% | 0.86% |
Similar Demographics by 2nd Grade
Demographics Similar to Jamaicans by 2nd Grade
In terms of 2nd grade, the demographic groups most similar to Jamaicans are Indian (Asian) (97.5%, a difference of 0.0%), Immigrants from Congo (97.5%, a difference of 0.0%), Immigrants from Colombia (97.5%, a difference of 0.0%), Yaqui (97.5%, a difference of 0.010%), and Fijian (97.5%, a difference of 0.010%).
| Demographics | Rating | Rank | 2nd Grade |
| Bolivians | 0.9 /100 | #249 | Tragic 97.5% |
| Peruvians | 0.9 /100 | #250 | Tragic 97.5% |
| Immigrants | Africa | 0.8 /100 | #251 | Tragic 97.5% |
| Immigrants | Asia | 0.7 /100 | #252 | Tragic 97.5% |
| Puerto Ricans | 0.7 /100 | #253 | Tragic 97.5% |
| Indians (Asian) | 0.6 /100 | #254 | Tragic 97.5% |
| Immigrants | Congo | 0.6 /100 | #255 | Tragic 97.5% |
| Jamaicans | 0.6 /100 | #256 | Tragic 97.5% |
| Immigrants | Colombia | 0.5 /100 | #257 | Tragic 97.5% |
| Yaqui | 0.5 /100 | #258 | Tragic 97.5% |
| Fijians | 0.5 /100 | #259 | Tragic 97.5% |
| Assyrians/Chaldeans/Syriacs | 0.5 /100 | #260 | Tragic 97.5% |
| Armenians | 0.5 /100 | #261 | Tragic 97.5% |
| Taiwanese | 0.4 /100 | #262 | Tragic 97.4% |
| Immigrants | Ethiopia | 0.4 /100 | #263 | Tragic 97.4% |
Demographics Similar to Immigrants from India by 2nd Grade
In terms of 2nd grade, the demographic groups most similar to Immigrants from India are Zimbabwean (98.2%, a difference of 0.0%), Immigrants from Western Europe (98.2%, a difference of 0.0%), Immigrants from South Africa (98.2%, a difference of 0.0%), Macedonian (98.2%, a difference of 0.010%), and Ukrainian (98.2%, a difference of 0.010%).
| Demographics | Rating | Rank | 2nd Grade |
| Immigrants | Australia | 99.0 /100 | #86 | Exceptional 98.2% |
| Immigrants | Denmark | 99.0 /100 | #87 | Exceptional 98.2% |
| Macedonians | 99.0 /100 | #88 | Exceptional 98.2% |
| Ukrainians | 98.9 /100 | #89 | Exceptional 98.2% |
| Zimbabweans | 98.8 /100 | #90 | Exceptional 98.2% |
| Immigrants | Western Europe | 98.8 /100 | #91 | Exceptional 98.2% |
| Immigrants | South Africa | 98.8 /100 | #92 | Exceptional 98.2% |
| Immigrants | India | 98.8 /100 | #93 | Exceptional 98.2% |
| Immigrants | Germany | 98.6 /100 | #94 | Exceptional 98.2% |
| South Africans | 98.6 /100 | #95 | Exceptional 98.2% |
| Cypriots | 98.4 /100 | #96 | Exceptional 98.2% |
| Choctaw | 98.3 /100 | #97 | Exceptional 98.2% |
| Immigrants | Nonimmigrants | 98.3 /100 | #98 | Exceptional 98.2% |
| Immigrants | Ireland | 98.0 /100 | #99 | Exceptional 98.2% |
| Romanians | 98.0 /100 | #100 | Exceptional 98.2% |