Subsaharan African vs Spanish American College, 1 year or more
COMPARE
Subsaharan African
Spanish American
College, 1 year or more
College, 1 year or more Comparison
Sub-Saharan Africans
Spanish Americans
57.3%
COLLEGE, 1 YEAR OR MORE
6.1/ 100
METRIC RATING
222nd/ 347
METRIC RANK
56.3%
COLLEGE, 1 YEAR OR MORE
1.8/ 100
METRIC RATING
234th/ 347
METRIC RANK
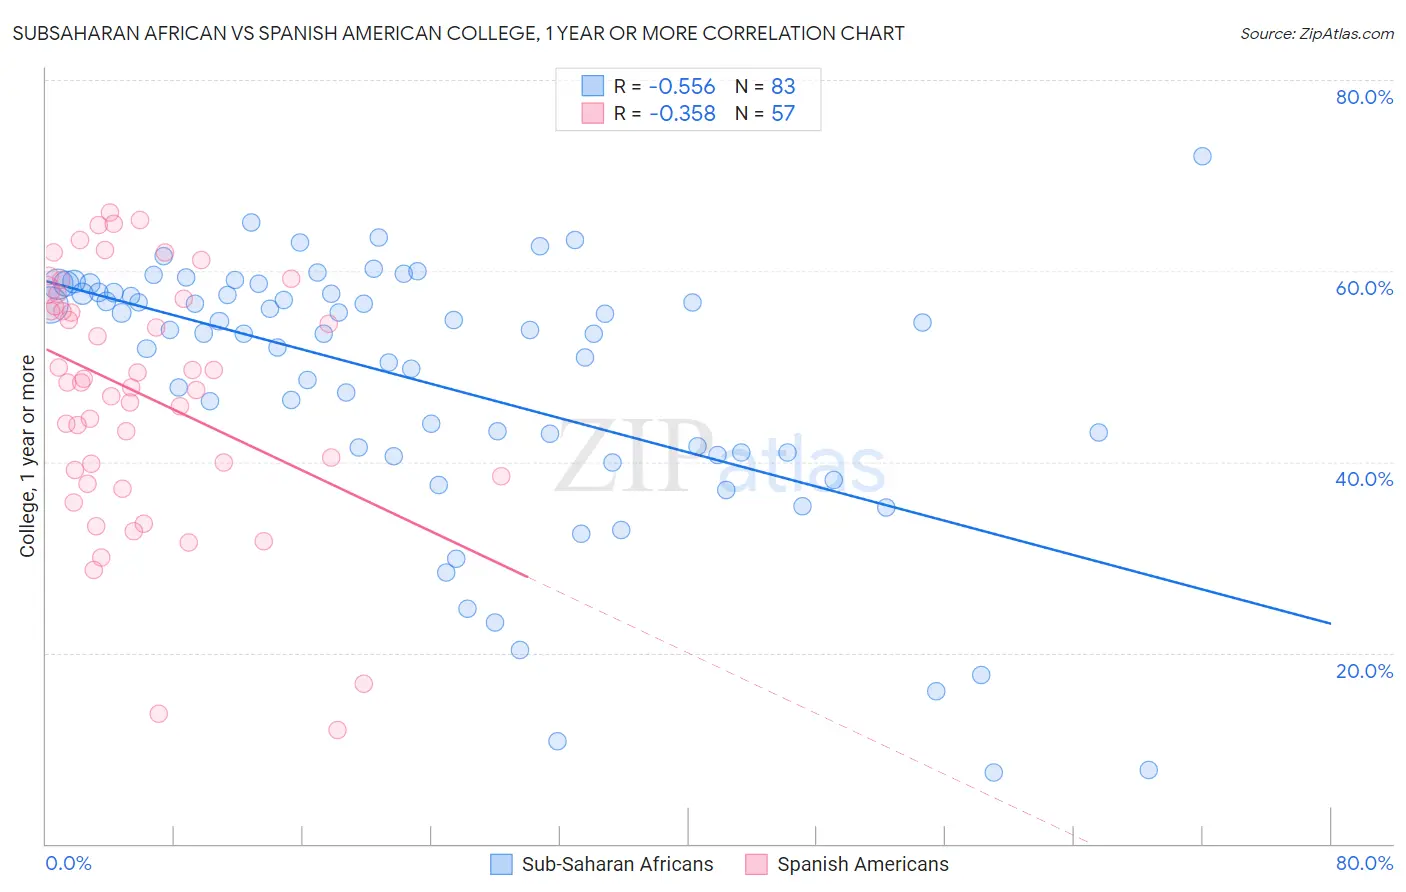
Subsaharan African vs Spanish American College, 1 year or more Correlation Chart
The statistical analysis conducted on geographies consisting of 508,212,148 people shows a substantial negative correlation between the proportion of Sub-Saharan Africans and percentage of population with at least college, 1 year or more education in the United States with a correlation coefficient (R) of -0.556 and weighted average of 57.3%. Similarly, the statistical analysis conducted on geographies consisting of 103,167,810 people shows a mild negative correlation between the proportion of Spanish Americans and percentage of population with at least college, 1 year or more education in the United States with a correlation coefficient (R) of -0.358 and weighted average of 56.3%, a difference of 1.8%.
College, 1 year or more Correlation Summary
| Measurement | Subsaharan African | Spanish American |
| Minimum | 7.4% | 11.9% |
| Maximum | 72.0% | 66.1% |
| Range | 64.6% | 54.2% |
| Mean | 48.2% | 47.1% |
| Median | 53.5% | 48.3% |
| Interquartile 25% (IQ1) | 40.9% | 38.8% |
| Interquartile 75% (IQ3) | 57.8% | 57.4% |
| Interquartile Range (IQR) | 16.8% | 18.6% |
| Standard Deviation (Sample) | 14.0% | 12.9% |
| Standard Deviation (Population) | 13.9% | 12.8% |
Demographics Similar to Sub-Saharan Africans and Spanish Americans by College, 1 year or more
In terms of college, 1 year or more, the demographic groups most similar to Sub-Saharan Africans are Portuguese (57.2%, a difference of 0.17%), Hmong (57.2%, a difference of 0.17%), Immigrants from Ghana (57.4%, a difference of 0.34%), Vietnamese (57.0%, a difference of 0.38%), and Immigrants from Western Africa (57.0%, a difference of 0.40%). Similarly, the demographic groups most similar to Spanish Americans are West Indian (56.3%, a difference of 0.0%), Iroquois (56.2%, a difference of 0.050%), Samoan (56.2%, a difference of 0.16%), Barbadian (56.0%, a difference of 0.43%), and Nonimmigrants (56.5%, a difference of 0.45%).
| Demographics | Rating | Rank | College, 1 year or more |
| Native Hawaiians | 9.0 /100 | #218 | Tragic 57.6% |
| Whites/Caucasians | 8.7 /100 | #219 | Tragic 57.6% |
| Immigrants | Costa Rica | 8.0 /100 | #220 | Tragic 57.5% |
| Immigrants | Ghana | 7.7 /100 | #221 | Tragic 57.4% |
| Sub-Saharan Africans | 6.1 /100 | #222 | Tragic 57.3% |
| Portuguese | 5.4 /100 | #223 | Tragic 57.2% |
| Hmong | 5.4 /100 | #224 | Tragic 57.2% |
| Vietnamese | 4.7 /100 | #225 | Tragic 57.0% |
| Immigrants | Western Africa | 4.6 /100 | #226 | Tragic 57.0% |
| Immigrants | Immigrants | 4.4 /100 | #227 | Tragic 57.0% |
| Immigrants | Fiji | 4.0 /100 | #228 | Tragic 56.9% |
| Cree | 3.6 /100 | #229 | Tragic 56.8% |
| Liberians | 3.1 /100 | #230 | Tragic 56.7% |
| Immigrants | Burma/Myanmar | 2.7 /100 | #231 | Tragic 56.6% |
| Immigrants | Bangladesh | 2.6 /100 | #232 | Tragic 56.6% |
| Immigrants | Nonimmigrants | 2.5 /100 | #233 | Tragic 56.5% |
| Spanish Americans | 1.8 /100 | #234 | Tragic 56.3% |
| West Indians | 1.8 /100 | #235 | Tragic 56.3% |
| Iroquois | 1.7 /100 | #236 | Tragic 56.2% |
| Samoans | 1.6 /100 | #237 | Tragic 56.2% |
| Barbadians | 1.3 /100 | #238 | Tragic 56.0% |