Slovak vs Spanish American College, 1 year or more
COMPARE
Slovak
Spanish American
College, 1 year or more
College, 1 year or more Comparison
Slovaks
Spanish Americans
58.5%
COLLEGE, 1 YEAR OR MORE
24.6/ 100
METRIC RATING
199th/ 347
METRIC RANK
56.3%
COLLEGE, 1 YEAR OR MORE
1.8/ 100
METRIC RATING
234th/ 347
METRIC RANK
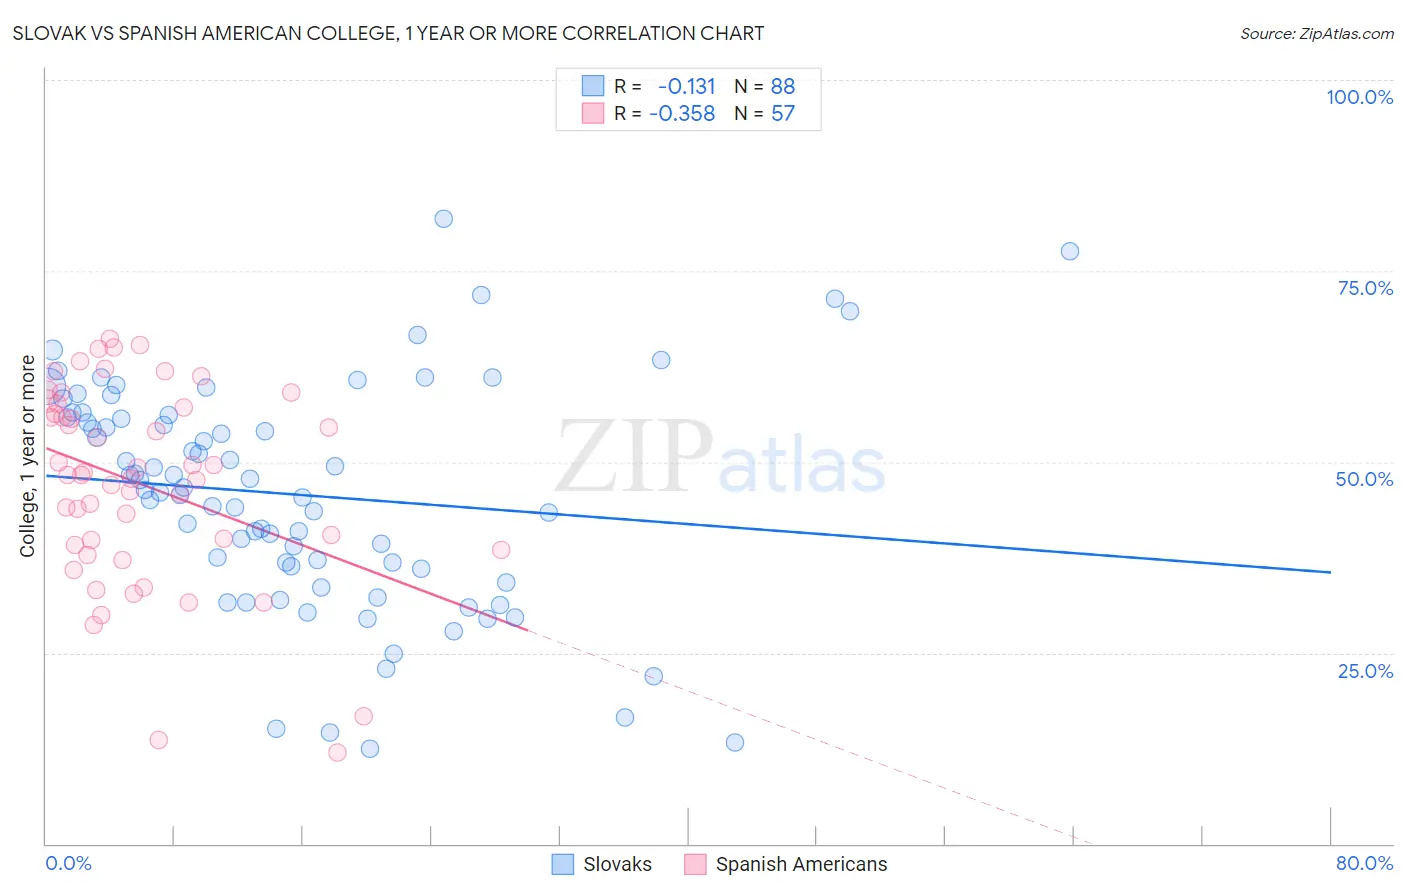
Slovak vs Spanish American College, 1 year or more Correlation Chart
The statistical analysis conducted on geographies consisting of 397,891,392 people shows a poor negative correlation between the proportion of Slovaks and percentage of population with at least college, 1 year or more education in the United States with a correlation coefficient (R) of -0.131 and weighted average of 58.5%. Similarly, the statistical analysis conducted on geographies consisting of 103,167,810 people shows a mild negative correlation between the proportion of Spanish Americans and percentage of population with at least college, 1 year or more education in the United States with a correlation coefficient (R) of -0.358 and weighted average of 56.3%, a difference of 4.0%.
College, 1 year or more Correlation Summary
| Measurement | Slovak | Spanish American |
| Minimum | 12.5% | 11.9% |
| Maximum | 81.8% | 66.1% |
| Range | 69.3% | 54.2% |
| Mean | 45.7% | 47.1% |
| Median | 46.4% | 48.3% |
| Interquartile 25% (IQ1) | 36.1% | 38.8% |
| Interquartile 75% (IQ3) | 55.9% | 57.4% |
| Interquartile Range (IQR) | 19.8% | 18.6% |
| Standard Deviation (Sample) | 14.7% | 12.9% |
| Standard Deviation (Population) | 14.6% | 12.8% |
Similar Demographics by College, 1 year or more
Demographics Similar to Slovaks by College, 1 year or more
In terms of college, 1 year or more, the demographic groups most similar to Slovaks are Spanish (58.5%, a difference of 0.030%), Immigrants from South Eastern Asia (58.5%, a difference of 0.040%), Immigrants from Thailand (58.6%, a difference of 0.10%), Dutch (58.6%, a difference of 0.11%), and Guamanian/Chamorro (58.6%, a difference of 0.11%).
| Demographics | Rating | Rank | College, 1 year or more |
| Colombians | 27.6 /100 | #192 | Fair 58.7% |
| Peruvians | 27.5 /100 | #193 | Fair 58.6% |
| Costa Ricans | 26.4 /100 | #194 | Fair 58.6% |
| Dutch | 26.2 /100 | #195 | Fair 58.6% |
| Guamanians/Chamorros | 26.2 /100 | #196 | Fair 58.6% |
| Immigrants | Thailand | 26.0 /100 | #197 | Fair 58.6% |
| Immigrants | South Eastern Asia | 25.1 /100 | #198 | Fair 58.5% |
| Slovaks | 24.6 /100 | #199 | Fair 58.5% |
| Spanish | 24.2 /100 | #200 | Fair 58.5% |
| Nigerians | 23.0 /100 | #201 | Fair 58.5% |
| Immigrants | South America | 21.9 /100 | #202 | Fair 58.4% |
| Ghanaians | 20.9 /100 | #203 | Fair 58.4% |
| Panamanians | 19.2 /100 | #204 | Poor 58.3% |
| Immigrants | Zaire | 18.7 /100 | #205 | Poor 58.3% |
| Immigrants | Vietnam | 18.2 /100 | #206 | Poor 58.2% |
Demographics Similar to Spanish Americans by College, 1 year or more
In terms of college, 1 year or more, the demographic groups most similar to Spanish Americans are West Indian (56.3%, a difference of 0.0%), Iroquois (56.2%, a difference of 0.050%), Samoan (56.2%, a difference of 0.16%), Barbadian (56.0%, a difference of 0.43%), and Nonimmigrants (56.5%, a difference of 0.45%).
| Demographics | Rating | Rank | College, 1 year or more |
| Immigrants | Immigrants | 4.4 /100 | #227 | Tragic 57.0% |
| Immigrants | Fiji | 4.0 /100 | #228 | Tragic 56.9% |
| Cree | 3.6 /100 | #229 | Tragic 56.8% |
| Liberians | 3.1 /100 | #230 | Tragic 56.7% |
| Immigrants | Burma/Myanmar | 2.7 /100 | #231 | Tragic 56.6% |
| Immigrants | Bangladesh | 2.6 /100 | #232 | Tragic 56.6% |
| Immigrants | Nonimmigrants | 2.5 /100 | #233 | Tragic 56.5% |
| Spanish Americans | 1.8 /100 | #234 | Tragic 56.3% |
| West Indians | 1.8 /100 | #235 | Tragic 56.3% |
| Iroquois | 1.7 /100 | #236 | Tragic 56.2% |
| Samoans | 1.6 /100 | #237 | Tragic 56.2% |
| Barbadians | 1.3 /100 | #238 | Tragic 56.0% |
| Puget Sound Salish | 1.1 /100 | #239 | Tragic 55.9% |
| Trinidadians and Tobagonians | 1.1 /100 | #240 | Tragic 55.8% |
| French American Indians | 1.0 /100 | #241 | Tragic 55.8% |