Immigrants from Lebanon vs Immigrants from Poland 2nd Grade
COMPARE
Immigrants from Lebanon
Immigrants from Poland
2nd Grade
2nd Grade Comparison
Immigrants from Lebanon
Immigrants from Poland
97.8%
2ND GRADE
20.9/ 100
METRIC RATING
200th/ 347
METRIC RANK
97.8%
2ND GRADE
42.2/ 100
METRIC RATING
183rd/ 347
METRIC RANK
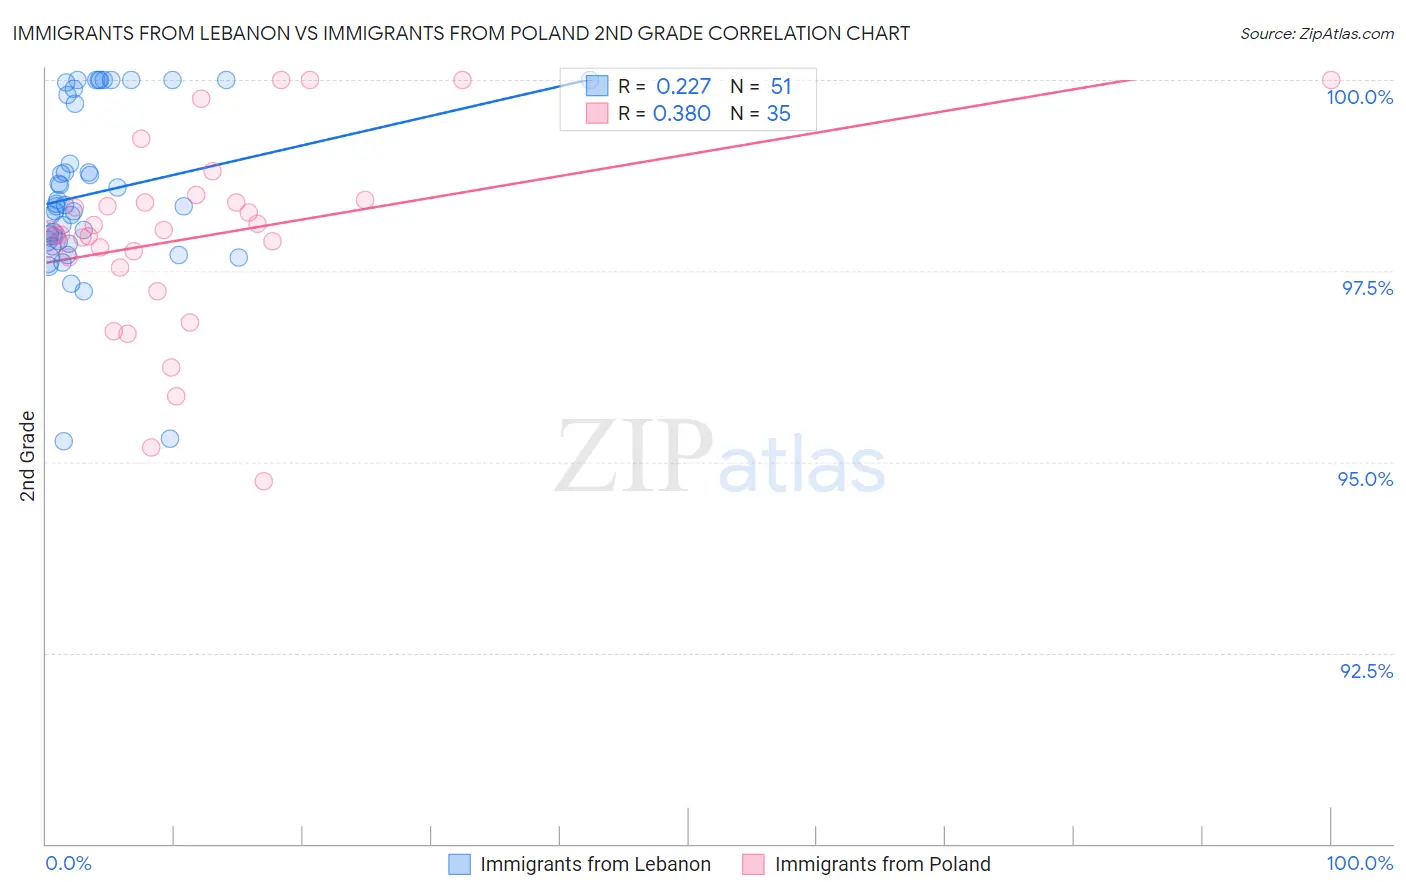
Immigrants from Lebanon vs Immigrants from Poland 2nd Grade Correlation Chart
The statistical analysis conducted on geographies consisting of 217,102,284 people shows a weak positive correlation between the proportion of Immigrants from Lebanon and percentage of population with at least 2nd grade education in the United States with a correlation coefficient (R) of 0.227 and weighted average of 97.8%. Similarly, the statistical analysis conducted on geographies consisting of 304,861,559 people shows a mild positive correlation between the proportion of Immigrants from Poland and percentage of population with at least 2nd grade education in the United States with a correlation coefficient (R) of 0.380 and weighted average of 97.8%, a difference of 0.080%.
2nd Grade Correlation Summary
| Measurement | Immigrants from Lebanon | Immigrants from Poland |
| Minimum | 95.3% | 94.8% |
| Maximum | 100.0% | 100.0% |
| Range | 4.7% | 5.2% |
| Mean | 98.5% | 98.0% |
| Median | 98.4% | 98.0% |
| Interquartile 25% (IQ1) | 97.9% | 97.5% |
| Interquartile 75% (IQ3) | 99.8% | 98.4% |
| Interquartile Range (IQR) | 1.9% | 0.89% |
| Standard Deviation (Sample) | 1.1% | 1.3% |
| Standard Deviation (Population) | 1.1% | 1.2% |
Demographics Similar to Immigrants from Lebanon and Immigrants from Poland by 2nd Grade
In terms of 2nd grade, the demographic groups most similar to Immigrants from Lebanon are Tohono O'odham (97.8%, a difference of 0.0%), Immigrants from Kenya (97.8%, a difference of 0.020%), Immigrants from Uganda (97.8%, a difference of 0.020%), Guamanian/Chamorro (97.8%, a difference of 0.020%), and Immigrants from Egypt (97.8%, a difference of 0.020%). Similarly, the demographic groups most similar to Immigrants from Poland are Portuguese (97.8%, a difference of 0.0%), Immigrants from Belarus (97.8%, a difference of 0.0%), Egyptian (97.9%, a difference of 0.010%), Immigrants from Argentina (97.8%, a difference of 0.010%), and Arab (97.8%, a difference of 0.020%).
| Demographics | Rating | Rank | 2nd Grade |
| Egyptians | 44.3 /100 | #181 | Average 97.9% |
| Portuguese | 42.4 /100 | #182 | Average 97.8% |
| Immigrants | Poland | 42.2 /100 | #183 | Average 97.8% |
| Immigrants | Belarus | 41.5 /100 | #184 | Average 97.8% |
| Immigrants | Argentina | 40.6 /100 | #185 | Average 97.8% |
| Arabs | 36.9 /100 | #186 | Fair 97.8% |
| Pakistanis | 36.1 /100 | #187 | Fair 97.8% |
| Immigrants | Kazakhstan | 35.6 /100 | #188 | Fair 97.8% |
| Panamanians | 33.5 /100 | #189 | Fair 97.8% |
| Immigrants | Taiwan | 31.8 /100 | #190 | Fair 97.8% |
| Paraguayans | 30.8 /100 | #191 | Fair 97.8% |
| Blacks/African Americans | 29.9 /100 | #192 | Fair 97.8% |
| Hawaiians | 28.5 /100 | #193 | Fair 97.8% |
| Paiute | 27.0 /100 | #194 | Fair 97.8% |
| Mongolians | 26.7 /100 | #195 | Fair 97.8% |
| Immigrants | Kenya | 26.4 /100 | #196 | Fair 97.8% |
| Immigrants | Uganda | 26.3 /100 | #197 | Fair 97.8% |
| Guamanians/Chamorros | 25.7 /100 | #198 | Fair 97.8% |
| Immigrants | Egypt | 24.4 /100 | #199 | Fair 97.8% |
| Immigrants | Lebanon | 20.9 /100 | #200 | Fair 97.8% |
| Tohono O'odham | 20.9 /100 | #201 | Fair 97.8% |