Immigrants from Cabo Verde vs Immigrants from Australia Nursery School
COMPARE
Immigrants from Cabo Verde
Immigrants from Australia
Nursery School
Nursery School Comparison
Immigrants from Cabo Verde
Immigrants from Australia
96.4%
NURSERY SCHOOL
0.0/ 100
METRIC RATING
341st/ 347
METRIC RANK
98.3%
NURSERY SCHOOL
99.0/ 100
METRIC RATING
86th/ 347
METRIC RANK
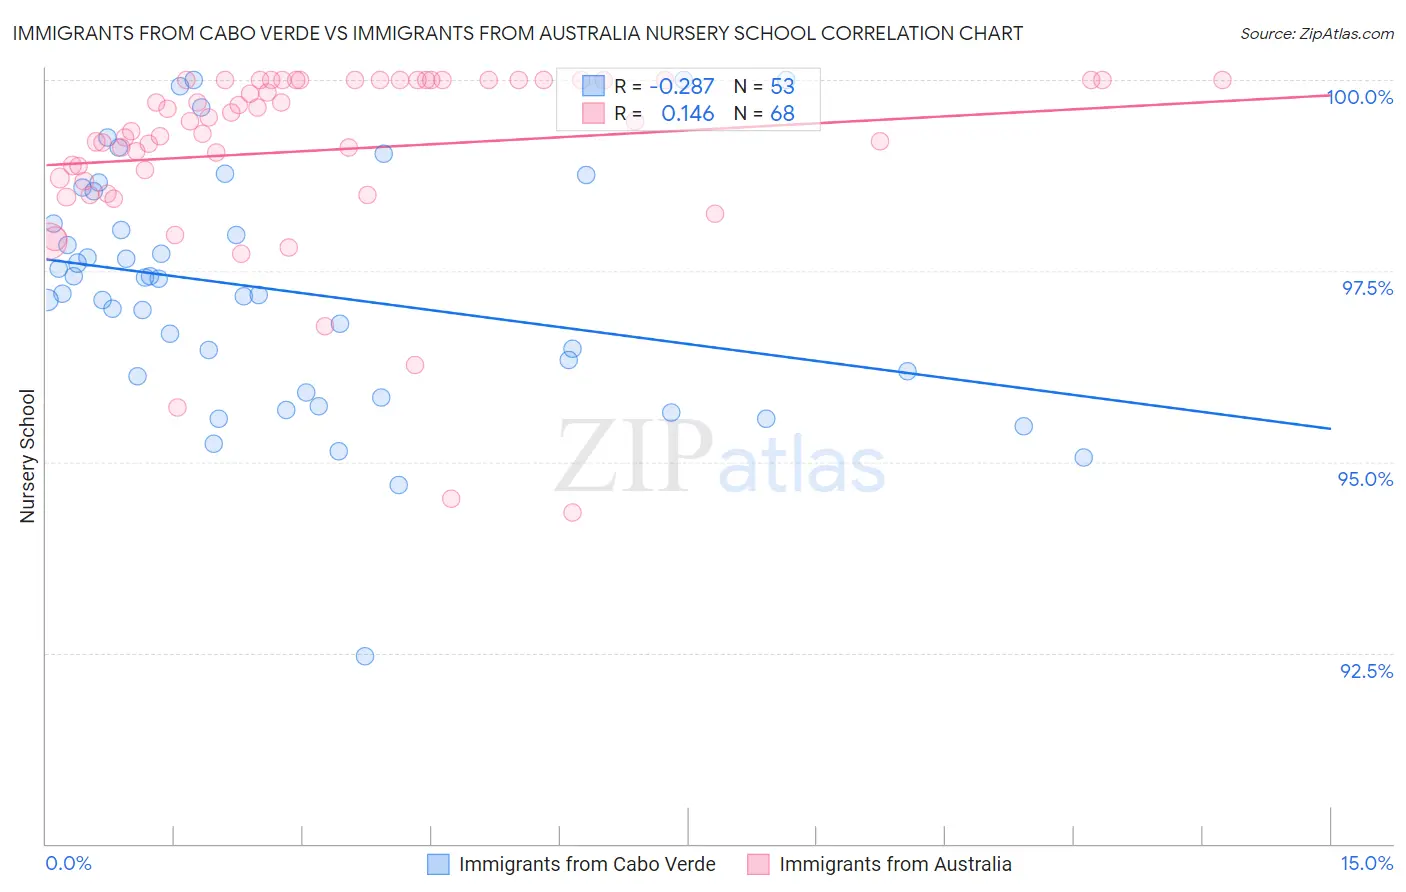
Immigrants from Cabo Verde vs Immigrants from Australia Nursery School Correlation Chart
The statistical analysis conducted on geographies consisting of 38,158,666 people shows a weak negative correlation between the proportion of Immigrants from Cabo Verde and percentage of population with at least nursery school education in the United States with a correlation coefficient (R) of -0.287 and weighted average of 96.4%. Similarly, the statistical analysis conducted on geographies consisting of 227,203,469 people shows a poor positive correlation between the proportion of Immigrants from Australia and percentage of population with at least nursery school education in the United States with a correlation coefficient (R) of 0.146 and weighted average of 98.3%, a difference of 2.0%.
Nursery School Correlation Summary
| Measurement | Immigrants from Cabo Verde | Immigrants from Australia |
| Minimum | 92.5% | 94.3% |
| Maximum | 100.0% | 100.0% |
| Range | 7.5% | 5.7% |
| Mean | 97.2% | 99.1% |
| Median | 97.2% | 99.5% |
| Interquartile 25% (IQ1) | 96.0% | 98.7% |
| Interquartile 75% (IQ3) | 98.3% | 100.0% |
| Interquartile Range (IQR) | 2.3% | 1.3% |
| Standard Deviation (Sample) | 1.6% | 1.2% |
| Standard Deviation (Population) | 1.5% | 1.2% |
Similar Demographics by Nursery School
Demographics Similar to Immigrants from Cabo Verde by Nursery School
In terms of nursery school, the demographic groups most similar to Immigrants from Cabo Verde are Immigrants from Mexico (96.4%, a difference of 0.010%), Immigrants from Central America (96.4%, a difference of 0.020%), Salvadoran (96.4%, a difference of 0.040%), Immigrants from Guatemala (96.4%, a difference of 0.060%), and Immigrants from Cambodia (96.5%, a difference of 0.13%).
| Demographics | Rating | Rank | Nursery School |
| Central Americans | 0.0 /100 | #333 | Tragic 96.6% |
| Immigrants | Dominican Republic | 0.0 /100 | #334 | Tragic 96.6% |
| Bangladeshis | 0.0 /100 | #335 | Tragic 96.6% |
| Guatemalans | 0.0 /100 | #336 | Tragic 96.6% |
| Immigrants | Cambodia | 0.0 /100 | #337 | Tragic 96.5% |
| Immigrants | Fiji | 0.0 /100 | #338 | Tragic 96.5% |
| Immigrants | Guatemala | 0.0 /100 | #339 | Tragic 96.4% |
| Immigrants | Central America | 0.0 /100 | #340 | Tragic 96.4% |
| Immigrants | Cabo Verde | 0.0 /100 | #341 | Tragic 96.4% |
| Immigrants | Mexico | 0.0 /100 | #342 | Tragic 96.4% |
| Salvadorans | 0.0 /100 | #343 | Tragic 96.4% |
| Immigrants | El Salvador | 0.0 /100 | #344 | Tragic 96.2% |
| Nepalese | 0.0 /100 | #345 | Tragic 96.2% |
| Immigrants | Yemen | 0.0 /100 | #346 | Tragic 95.9% |
| Spanish American Indians | 0.0 /100 | #347 | Tragic 95.8% |
Demographics Similar to Immigrants from Australia by Nursery School
In terms of nursery school, the demographic groups most similar to Immigrants from Australia are Osage (98.3%, a difference of 0.010%), Immigrants from Denmark (98.3%, a difference of 0.010%), Immigrants from Sweden (98.3%, a difference of 0.010%), Hopi (98.3%, a difference of 0.010%), and Ukrainian (98.3%, a difference of 0.010%).
| Demographics | Rating | Rank | Nursery School |
| Immigrants | Belgium | 99.3 /100 | #79 | Exceptional 98.3% |
| Shoshone | 99.3 /100 | #80 | Exceptional 98.3% |
| Icelanders | 99.2 /100 | #81 | Exceptional 98.3% |
| Potawatomi | 99.2 /100 | #82 | Exceptional 98.3% |
| Osage | 99.1 /100 | #83 | Exceptional 98.3% |
| Immigrants | Denmark | 99.1 /100 | #84 | Exceptional 98.3% |
| Immigrants | Sweden | 99.1 /100 | #85 | Exceptional 98.3% |
| Immigrants | Australia | 99.0 /100 | #86 | Exceptional 98.3% |
| Hopi | 98.9 /100 | #87 | Exceptional 98.3% |
| Ukrainians | 98.9 /100 | #88 | Exceptional 98.3% |
| Immigrants | South Africa | 98.8 /100 | #89 | Exceptional 98.3% |
| Immigrants | Western Europe | 98.8 /100 | #90 | Exceptional 98.3% |
| Zimbabweans | 98.8 /100 | #91 | Exceptional 98.3% |
| Macedonians | 98.7 /100 | #92 | Exceptional 98.3% |
| Immigrants | India | 98.7 /100 | #93 | Exceptional 98.3% |