Swiss vs Dominican 6th Grade
COMPARE
Swiss
Dominican
6th Grade
6th Grade Comparison
Swiss
Dominicans
97.9%
6TH GRADE
100.0/ 100
METRIC RATING
34th/ 347
METRIC RANK
94.9%
6TH GRADE
0.0/ 100
METRIC RATING
329th/ 347
METRIC RANK
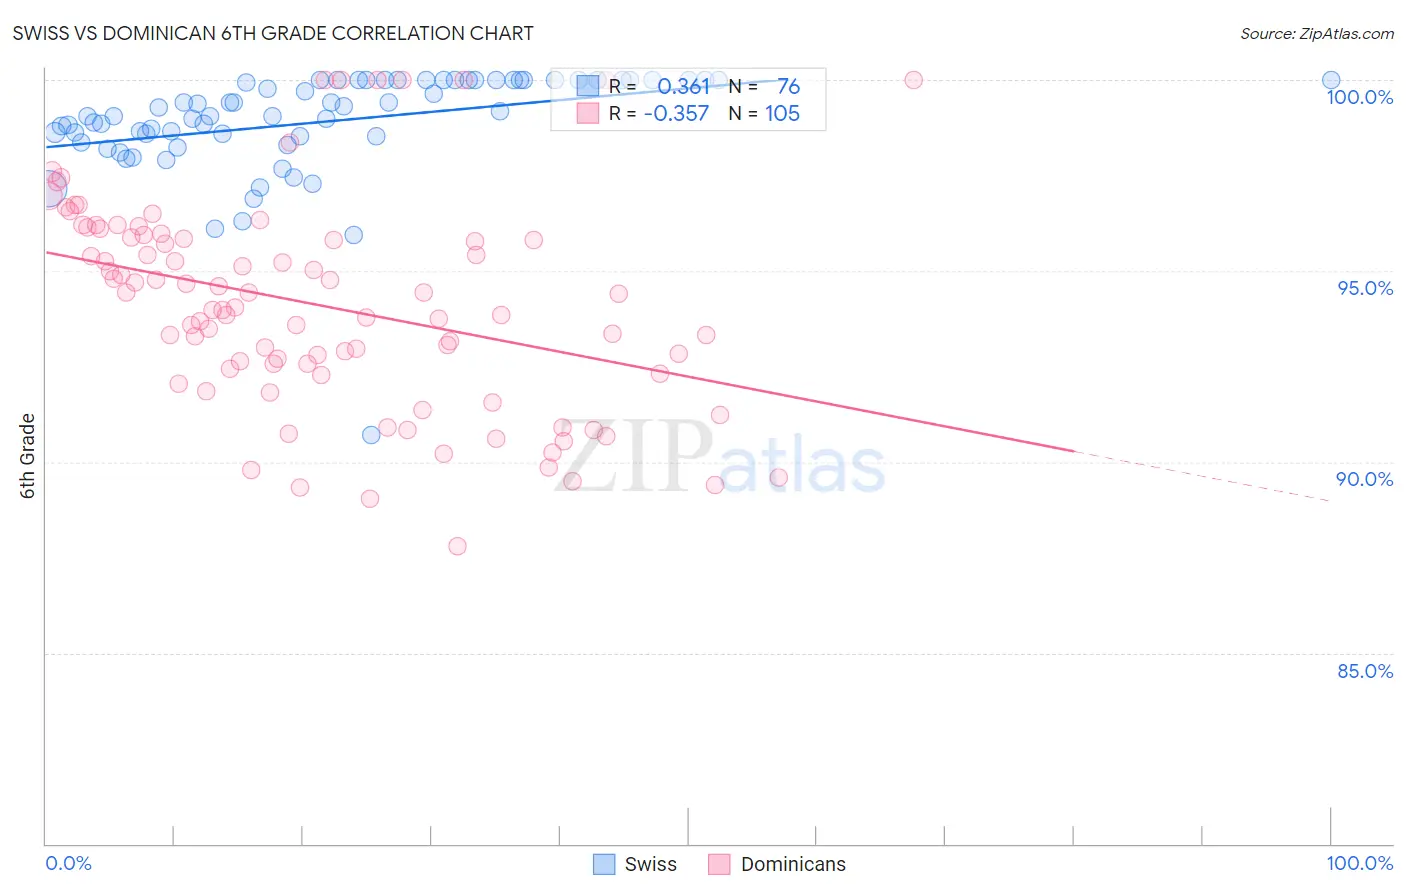
Swiss vs Dominican 6th Grade Correlation Chart
The statistical analysis conducted on geographies consisting of 465,021,856 people shows a mild positive correlation between the proportion of Swiss and percentage of population with at least 6th grade education in the United States with a correlation coefficient (R) of 0.361 and weighted average of 97.9%. Similarly, the statistical analysis conducted on geographies consisting of 355,142,603 people shows a mild negative correlation between the proportion of Dominicans and percentage of population with at least 6th grade education in the United States with a correlation coefficient (R) of -0.357 and weighted average of 94.9%, a difference of 3.2%.
6th Grade Correlation Summary
| Measurement | Swiss | Dominican |
| Minimum | 90.7% | 87.8% |
| Maximum | 100.0% | 100.0% |
| Range | 9.3% | 12.2% |
| Mean | 98.9% | 94.1% |
| Median | 99.1% | 94.0% |
| Interquartile 25% (IQ1) | 98.5% | 92.4% |
| Interquartile 75% (IQ3) | 100.0% | 95.9% |
| Interquartile Range (IQR) | 1.5% | 3.5% |
| Standard Deviation (Sample) | 1.4% | 2.7% |
| Standard Deviation (Population) | 1.4% | 2.7% |
Similar Demographics by 6th Grade
Demographics Similar to Swiss by 6th Grade
In terms of 6th grade, the demographic groups most similar to Swiss are Chippewa (97.9%, a difference of 0.0%), Chinese (97.9%, a difference of 0.020%), Italian (97.9%, a difference of 0.030%), British (97.9%, a difference of 0.030%), and Alaska Native (98.0%, a difference of 0.040%).
| Demographics | Rating | Rank | 6th Grade |
| Yup'ik | 100.0 /100 | #27 | Exceptional 98.0% |
| Scandinavians | 100.0 /100 | #28 | Exceptional 98.0% |
| French | 100.0 /100 | #29 | Exceptional 98.0% |
| French Canadians | 100.0 /100 | #30 | Exceptional 98.0% |
| Europeans | 100.0 /100 | #31 | Exceptional 98.0% |
| Alaska Natives | 100.0 /100 | #32 | Exceptional 98.0% |
| Chippewa | 100.0 /100 | #33 | Exceptional 97.9% |
| Swiss | 100.0 /100 | #34 | Exceptional 97.9% |
| Chinese | 100.0 /100 | #35 | Exceptional 97.9% |
| Italians | 100.0 /100 | #36 | Exceptional 97.9% |
| British | 100.0 /100 | #37 | Exceptional 97.9% |
| Belgians | 100.0 /100 | #38 | Exceptional 97.9% |
| Luxembourgers | 99.9 /100 | #39 | Exceptional 97.9% |
| Latvians | 99.9 /100 | #40 | Exceptional 97.9% |
| Eastern Europeans | 99.9 /100 | #41 | Exceptional 97.9% |
Demographics Similar to Dominicans by 6th Grade
In terms of 6th grade, the demographic groups most similar to Dominicans are Honduran (95.0%, a difference of 0.060%), Mexican American Indian (95.0%, a difference of 0.070%), Nepalese (94.9%, a difference of 0.070%), Immigrants from Armenia (94.9%, a difference of 0.080%), and Hispanic or Latino (95.0%, a difference of 0.10%).
| Demographics | Rating | Rank | 6th Grade |
| Immigrants | Cambodia | 0.0 /100 | #322 | Tragic 95.2% |
| Central American Indians | 0.0 /100 | #323 | Tragic 95.1% |
| Cape Verdeans | 0.0 /100 | #324 | Tragic 95.1% |
| Immigrants | Nicaragua | 0.0 /100 | #325 | Tragic 95.1% |
| Hispanics or Latinos | 0.0 /100 | #326 | Tragic 95.0% |
| Mexican American Indians | 0.0 /100 | #327 | Tragic 95.0% |
| Hondurans | 0.0 /100 | #328 | Tragic 95.0% |
| Dominicans | 0.0 /100 | #329 | Tragic 94.9% |
| Nepalese | 0.0 /100 | #330 | Tragic 94.9% |
| Immigrants | Armenia | 0.0 /100 | #331 | Tragic 94.9% |
| Immigrants | Honduras | 0.0 /100 | #332 | Tragic 94.8% |
| Immigrants | Latin America | 0.0 /100 | #333 | Tragic 94.7% |
| Immigrants | Azores | 0.0 /100 | #334 | Tragic 94.7% |
| Mexicans | 0.0 /100 | #335 | Tragic 94.6% |
| Immigrants | Dominican Republic | 0.0 /100 | #336 | Tragic 94.6% |