Subsaharan African vs Immigrants from Portugal 4th Grade
COMPARE
Subsaharan African
Immigrants from Portugal
4th Grade
4th Grade Comparison
Sub-Saharan Africans
Immigrants from Portugal
97.2%
4TH GRADE
3.6/ 100
METRIC RATING
228th/ 347
METRIC RANK
96.6%
4TH GRADE
0.0/ 100
METRIC RATING
295th/ 347
METRIC RANK
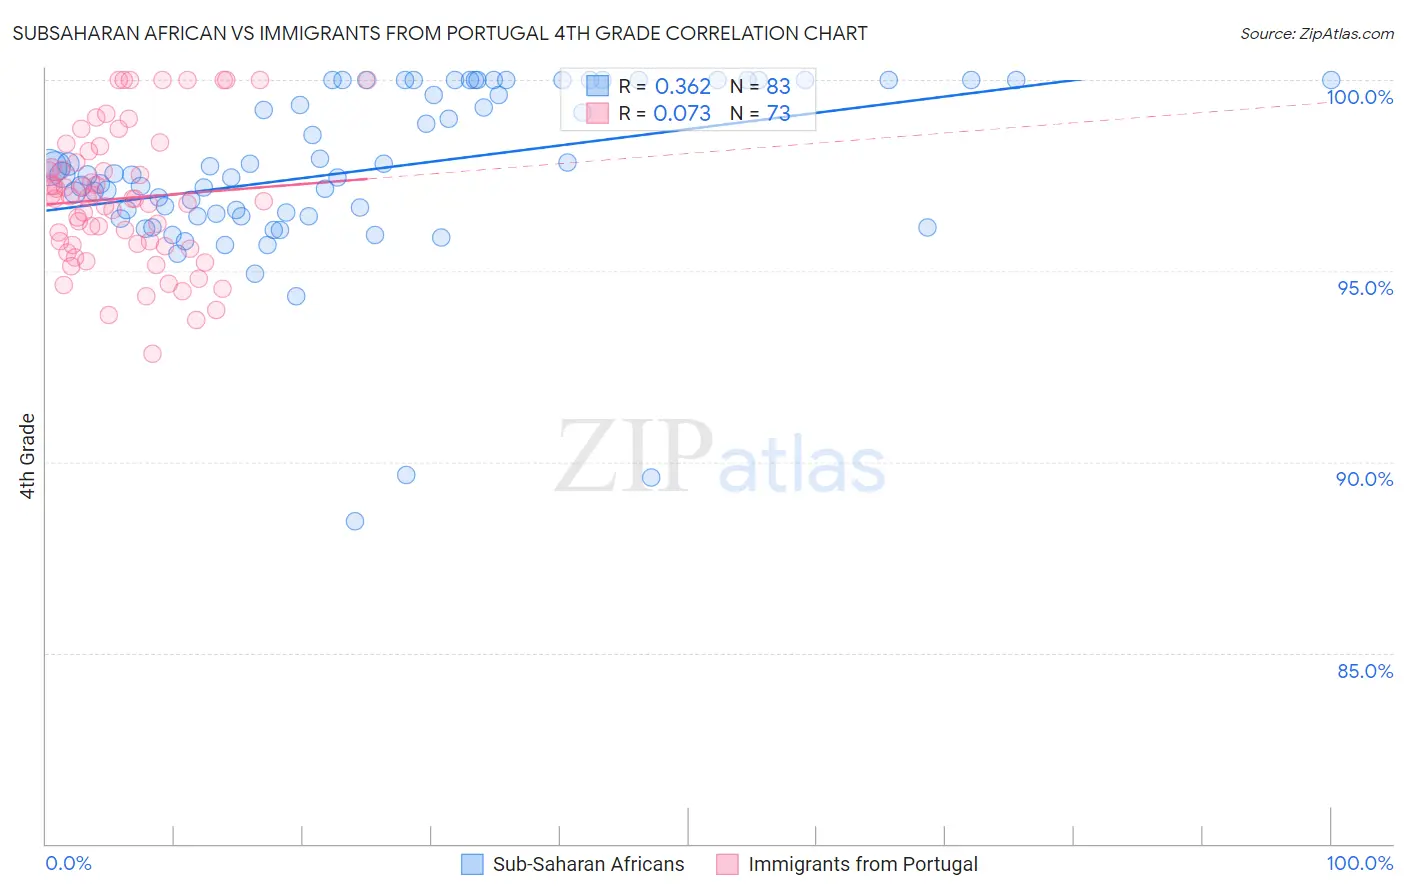
Subsaharan African vs Immigrants from Portugal 4th Grade Correlation Chart
The statistical analysis conducted on geographies consisting of 508,209,362 people shows a mild positive correlation between the proportion of Sub-Saharan Africans and percentage of population with at least 4th grade education in the United States with a correlation coefficient (R) of 0.362 and weighted average of 97.2%. Similarly, the statistical analysis conducted on geographies consisting of 174,792,107 people shows a slight positive correlation between the proportion of Immigrants from Portugal and percentage of population with at least 4th grade education in the United States with a correlation coefficient (R) of 0.073 and weighted average of 96.6%, a difference of 0.59%.
4th Grade Correlation Summary
| Measurement | Subsaharan African | Immigrants from Portugal |
| Minimum | 88.4% | 92.8% |
| Maximum | 100.0% | 100.0% |
| Range | 11.6% | 7.2% |
| Mean | 97.6% | 96.9% |
| Median | 97.5% | 96.9% |
| Interquartile 25% (IQ1) | 96.4% | 95.7% |
| Interquartile 75% (IQ3) | 100.0% | 98.0% |
| Interquartile Range (IQR) | 3.6% | 2.3% |
| Standard Deviation (Sample) | 2.3% | 1.8% |
| Standard Deviation (Population) | 2.3% | 1.8% |
Similar Demographics by 4th Grade
Demographics Similar to Sub-Saharan Africans by 4th Grade
In terms of 4th grade, the demographic groups most similar to Sub-Saharan Africans are Immigrants from Pakistan (97.2%, a difference of 0.0%), Liberian (97.2%, a difference of 0.0%), Uruguayan (97.2%, a difference of 0.0%), Bahamian (97.2%, a difference of 0.010%), and Immigrants from Malaysia (97.2%, a difference of 0.010%).
| Demographics | Rating | Rank | 4th Grade |
| Immigrants | Panama | 5.4 /100 | #221 | Tragic 97.3% |
| Immigrants | Lebanon | 5.1 /100 | #222 | Tragic 97.3% |
| Immigrants | Sudan | 5.0 /100 | #223 | Tragic 97.2% |
| Immigrants | Syria | 5.0 /100 | #224 | Tragic 97.2% |
| Immigrants | Iraq | 4.6 /100 | #225 | Tragic 97.2% |
| Bahamians | 3.8 /100 | #226 | Tragic 97.2% |
| Immigrants | Pakistan | 3.7 /100 | #227 | Tragic 97.2% |
| Sub-Saharan Africans | 3.6 /100 | #228 | Tragic 97.2% |
| Liberians | 3.6 /100 | #229 | Tragic 97.2% |
| Uruguayans | 3.5 /100 | #230 | Tragic 97.2% |
| Immigrants | Malaysia | 3.4 /100 | #231 | Tragic 97.2% |
| Immigrants | Western Asia | 3.4 /100 | #232 | Tragic 97.2% |
| Senegalese | 3.1 /100 | #233 | Tragic 97.2% |
| Assyrians/Chaldeans/Syriacs | 3.0 /100 | #234 | Tragic 97.2% |
| Yuman | 2.9 /100 | #235 | Tragic 97.2% |
Demographics Similar to Immigrants from Portugal by 4th Grade
In terms of 4th grade, the demographic groups most similar to Immigrants from Portugal are Somali (96.6%, a difference of 0.010%), Immigrants from Eritrea (96.7%, a difference of 0.020%), Puerto Rican (96.7%, a difference of 0.040%), Malaysian (96.7%, a difference of 0.060%), and Immigrants from Grenada (96.7%, a difference of 0.070%).
| Demographics | Rating | Rank | 4th Grade |
| Immigrants | Afghanistan | 0.0 /100 | #288 | Tragic 96.8% |
| Immigrants | West Indies | 0.0 /100 | #289 | Tragic 96.7% |
| British West Indians | 0.0 /100 | #290 | Tragic 96.7% |
| Immigrants | Grenada | 0.0 /100 | #291 | Tragic 96.7% |
| Malaysians | 0.0 /100 | #292 | Tragic 96.7% |
| Puerto Ricans | 0.0 /100 | #293 | Tragic 96.7% |
| Immigrants | Eritrea | 0.0 /100 | #294 | Tragic 96.7% |
| Immigrants | Portugal | 0.0 /100 | #295 | Tragic 96.6% |
| Somalis | 0.0 /100 | #296 | Tragic 96.6% |
| Immigrants | Somalia | 0.0 /100 | #297 | Tragic 96.5% |
| Haitians | 0.0 /100 | #298 | Tragic 96.5% |
| Immigrants | Dominica | 0.0 /100 | #299 | Tragic 96.5% |
| Immigrants | South Eastern Asia | 0.0 /100 | #300 | Tragic 96.5% |
| Immigrants | Immigrants | 0.0 /100 | #301 | Tragic 96.5% |
| Immigrants | Cuba | 0.0 /100 | #302 | Tragic 96.4% |