Tongan vs Immigrants from West Indies 4th Grade
COMPARE
Tongan
Immigrants from West Indies
4th Grade
4th Grade Comparison
Tongans
Immigrants from West Indies
97.3%
4TH GRADE
5.8/ 100
METRIC RATING
219th/ 347
METRIC RANK
96.7%
4TH GRADE
0.0/ 100
METRIC RATING
289th/ 347
METRIC RANK
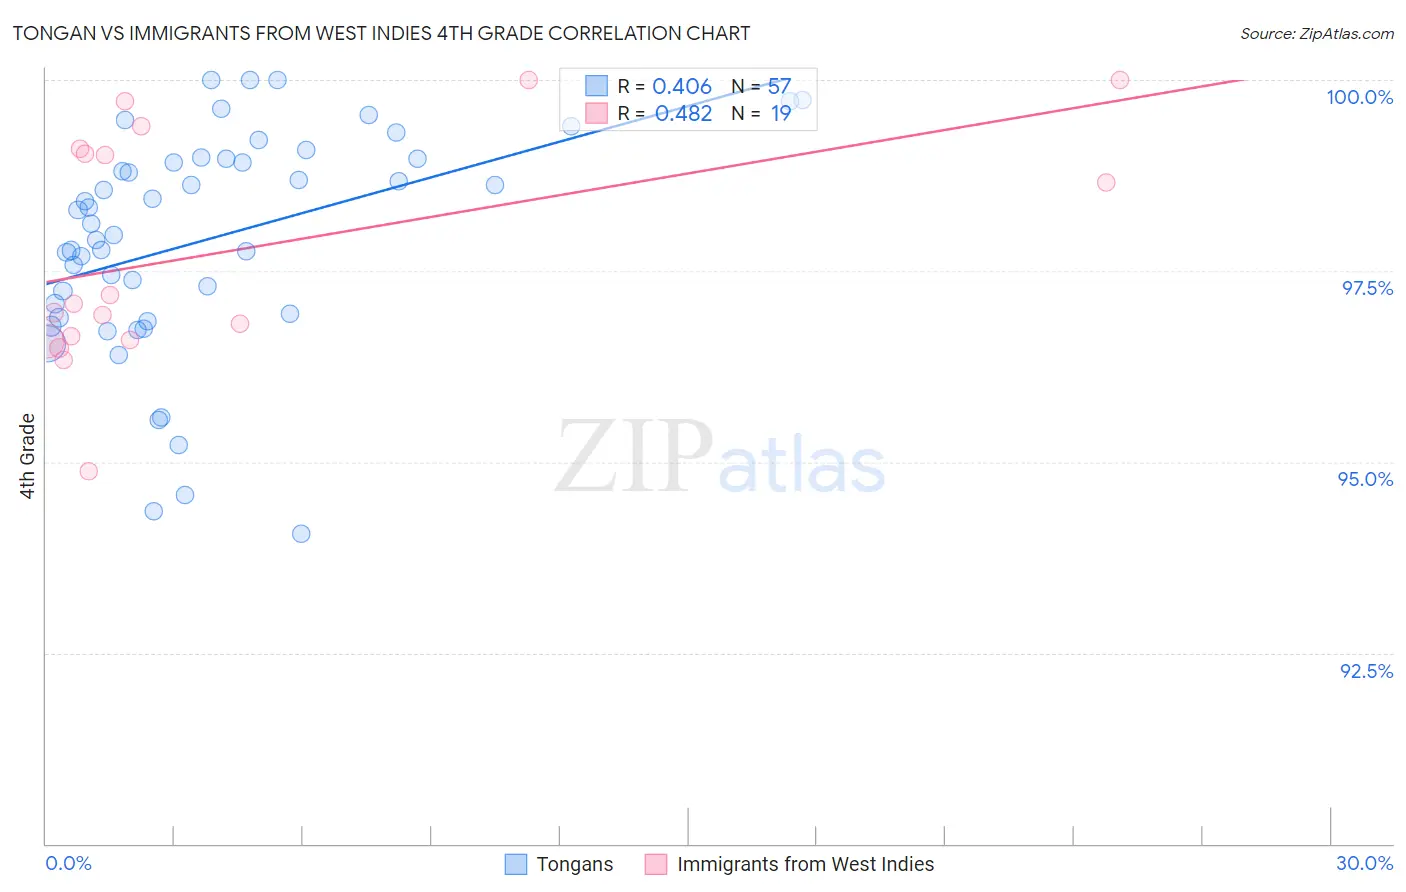
Tongan vs Immigrants from West Indies 4th Grade Correlation Chart
The statistical analysis conducted on geographies consisting of 102,877,776 people shows a moderate positive correlation between the proportion of Tongans and percentage of population with at least 4th grade education in the United States with a correlation coefficient (R) of 0.406 and weighted average of 97.3%. Similarly, the statistical analysis conducted on geographies consisting of 72,457,514 people shows a moderate positive correlation between the proportion of Immigrants from West Indies and percentage of population with at least 4th grade education in the United States with a correlation coefficient (R) of 0.482 and weighted average of 96.7%, a difference of 0.53%.
4th Grade Correlation Summary
| Measurement | Tongan | Immigrants from West Indies |
| Minimum | 94.1% | 94.9% |
| Maximum | 100.0% | 100.0% |
| Range | 5.9% | 5.1% |
| Mean | 97.9% | 97.8% |
| Median | 98.1% | 97.1% |
| Interquartile 25% (IQ1) | 96.9% | 96.6% |
| Interquartile 75% (IQ3) | 99.0% | 99.1% |
| Interquartile Range (IQR) | 2.1% | 2.5% |
| Standard Deviation (Sample) | 1.4% | 1.5% |
| Standard Deviation (Population) | 1.4% | 1.5% |
Similar Demographics by 4th Grade
Demographics Similar to Tongans by 4th Grade
In terms of 4th grade, the demographic groups most similar to Tongans are Sierra Leonean (97.3%, a difference of 0.010%), Iraqi (97.3%, a difference of 0.010%), South American Indian (97.3%, a difference of 0.010%), Immigrants from Panama (97.3%, a difference of 0.010%), and Immigrants from Lebanon (97.3%, a difference of 0.010%).
| Demographics | Rating | Rank | 4th Grade |
| Tohono O'odham | 8.4 /100 | #212 | Tragic 97.3% |
| Costa Ricans | 8.3 /100 | #213 | Tragic 97.3% |
| Immigrants | Nepal | 7.7 /100 | #214 | Tragic 97.3% |
| Immigrants | Morocco | 7.1 /100 | #215 | Tragic 97.3% |
| Samoans | 6.8 /100 | #216 | Tragic 97.3% |
| Sierra Leoneans | 6.5 /100 | #217 | Tragic 97.3% |
| Iraqis | 6.3 /100 | #218 | Tragic 97.3% |
| Tongans | 5.8 /100 | #219 | Tragic 97.3% |
| South American Indians | 5.5 /100 | #220 | Tragic 97.3% |
| Immigrants | Panama | 5.4 /100 | #221 | Tragic 97.3% |
| Immigrants | Lebanon | 5.1 /100 | #222 | Tragic 97.3% |
| Immigrants | Sudan | 5.0 /100 | #223 | Tragic 97.2% |
| Immigrants | Syria | 5.0 /100 | #224 | Tragic 97.2% |
| Immigrants | Iraq | 4.6 /100 | #225 | Tragic 97.2% |
| Bahamians | 3.8 /100 | #226 | Tragic 97.2% |
Demographics Similar to Immigrants from West Indies by 4th Grade
In terms of 4th grade, the demographic groups most similar to Immigrants from West Indies are British West Indian (96.7%, a difference of 0.010%), Houma (96.8%, a difference of 0.020%), Immigrants from Afghanistan (96.8%, a difference of 0.020%), Immigrants from Grenada (96.7%, a difference of 0.040%), and Malaysian (96.7%, a difference of 0.050%).
| Demographics | Rating | Rank | 4th Grade |
| Immigrants | Trinidad and Tobago | 0.1 /100 | #282 | Tragic 96.8% |
| Immigrants | Philippines | 0.1 /100 | #283 | Tragic 96.8% |
| Immigrants | St. Vincent and the Grenadines | 0.1 /100 | #284 | Tragic 96.8% |
| Immigrants | Barbados | 0.0 /100 | #285 | Tragic 96.8% |
| Immigrants | Thailand | 0.0 /100 | #286 | Tragic 96.8% |
| Houma | 0.0 /100 | #287 | Tragic 96.8% |
| Immigrants | Afghanistan | 0.0 /100 | #288 | Tragic 96.8% |
| Immigrants | West Indies | 0.0 /100 | #289 | Tragic 96.7% |
| British West Indians | 0.0 /100 | #290 | Tragic 96.7% |
| Immigrants | Grenada | 0.0 /100 | #291 | Tragic 96.7% |
| Malaysians | 0.0 /100 | #292 | Tragic 96.7% |
| Puerto Ricans | 0.0 /100 | #293 | Tragic 96.7% |
| Immigrants | Eritrea | 0.0 /100 | #294 | Tragic 96.7% |
| Immigrants | Portugal | 0.0 /100 | #295 | Tragic 96.6% |
| Somalis | 0.0 /100 | #296 | Tragic 96.6% |