Sri Lankan vs Immigrants from North America 4th Grade
COMPARE
Sri Lankan
Immigrants from North America
4th Grade
4th Grade Comparison
Sri Lankans
Immigrants from North America
96.4%
4TH GRADE
0.0/ 100
METRIC RATING
306th/ 347
METRIC RANK
98.1%
4TH GRADE
99.7/ 100
METRIC RATING
61st/ 347
METRIC RANK
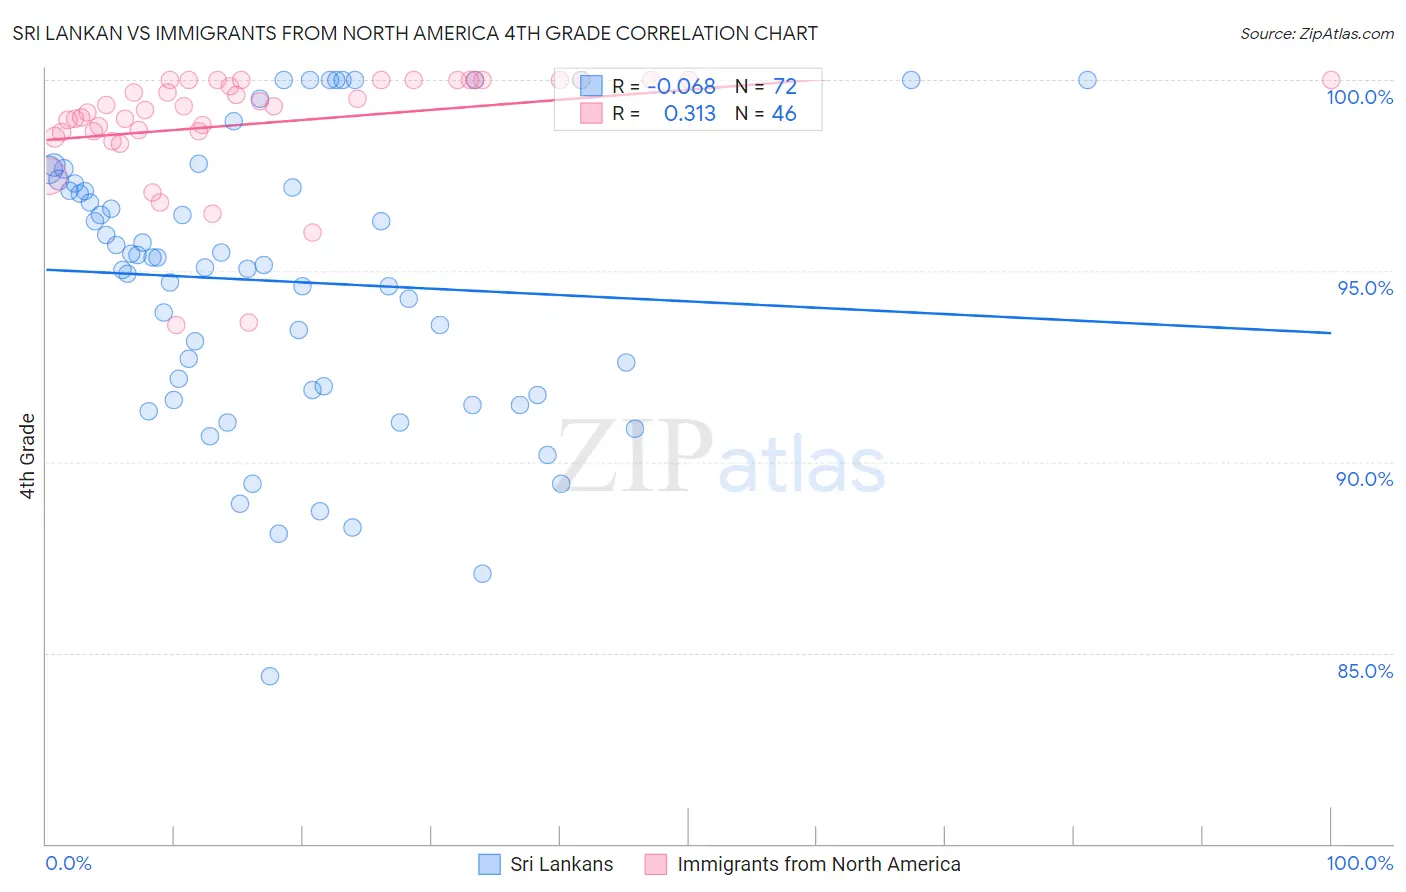
Sri Lankan vs Immigrants from North America 4th Grade Correlation Chart
The statistical analysis conducted on geographies consisting of 440,593,746 people shows a slight negative correlation between the proportion of Sri Lankans and percentage of population with at least 4th grade education in the United States with a correlation coefficient (R) of -0.068 and weighted average of 96.4%. Similarly, the statistical analysis conducted on geographies consisting of 462,462,400 people shows a mild positive correlation between the proportion of Immigrants from North America and percentage of population with at least 4th grade education in the United States with a correlation coefficient (R) of 0.313 and weighted average of 98.1%, a difference of 1.8%.
4th Grade Correlation Summary
| Measurement | Sri Lankan | Immigrants from North America |
| Minimum | 84.4% | 93.6% |
| Maximum | 100.0% | 100.0% |
| Range | 15.6% | 6.4% |
| Mean | 94.7% | 98.9% |
| Median | 95.3% | 99.3% |
| Interquartile 25% (IQ1) | 91.8% | 98.6% |
| Interquartile 75% (IQ3) | 97.2% | 100.0% |
| Interquartile Range (IQR) | 5.4% | 1.4% |
| Standard Deviation (Sample) | 3.7% | 1.5% |
| Standard Deviation (Population) | 3.7% | 1.5% |
Similar Demographics by 4th Grade
Demographics Similar to Sri Lankans by 4th Grade
In terms of 4th grade, the demographic groups most similar to Sri Lankans are Immigrants from Caribbean (96.4%, a difference of 0.010%), Ecuadorian (96.4%, a difference of 0.030%), Immigrants from Haiti (96.3%, a difference of 0.030%), Immigrants from Laos (96.3%, a difference of 0.030%), and Guyanese (96.4%, a difference of 0.040%).
| Demographics | Rating | Rank | 4th Grade |
| Immigrants | Dominica | 0.0 /100 | #299 | Tragic 96.5% |
| Immigrants | South Eastern Asia | 0.0 /100 | #300 | Tragic 96.5% |
| Immigrants | Immigrants | 0.0 /100 | #301 | Tragic 96.5% |
| Immigrants | Cuba | 0.0 /100 | #302 | Tragic 96.4% |
| Guyanese | 0.0 /100 | #303 | Tragic 96.4% |
| Ecuadorians | 0.0 /100 | #304 | Tragic 96.4% |
| Immigrants | Caribbean | 0.0 /100 | #305 | Tragic 96.4% |
| Sri Lankans | 0.0 /100 | #306 | Tragic 96.4% |
| Immigrants | Haiti | 0.0 /100 | #307 | Tragic 96.3% |
| Immigrants | Laos | 0.0 /100 | #308 | Tragic 96.3% |
| Immigrants | Guyana | 0.0 /100 | #309 | Tragic 96.3% |
| Immigrants | Burma/Myanmar | 0.0 /100 | #310 | Tragic 96.3% |
| Immigrants | Bangladesh | 0.0 /100 | #311 | Tragic 96.2% |
| Cape Verdeans | 0.0 /100 | #312 | Tragic 96.2% |
| Indonesians | 0.0 /100 | #313 | Tragic 96.2% |
Demographics Similar to Immigrants from North America by 4th Grade
In terms of 4th grade, the demographic groups most similar to Immigrants from North America are Serbian (98.1%, a difference of 0.0%), Immigrants from Canada (98.1%, a difference of 0.010%), Russian (98.0%, a difference of 0.010%), American (98.1%, a difference of 0.020%), and Cajun (98.0%, a difference of 0.020%).
| Demographics | Rating | Rank | 4th Grade |
| Maltese | 99.8 /100 | #54 | Exceptional 98.1% |
| Whites/Caucasians | 99.8 /100 | #55 | Exceptional 98.1% |
| Greeks | 99.8 /100 | #56 | Exceptional 98.1% |
| Austrians | 99.8 /100 | #57 | Exceptional 98.1% |
| Creek | 99.8 /100 | #58 | Exceptional 98.1% |
| Americans | 99.8 /100 | #59 | Exceptional 98.1% |
| Immigrants | Canada | 99.7 /100 | #60 | Exceptional 98.1% |
| Immigrants | North America | 99.7 /100 | #61 | Exceptional 98.1% |
| Serbians | 99.7 /100 | #62 | Exceptional 98.1% |
| Russians | 99.7 /100 | #63 | Exceptional 98.0% |
| Cajuns | 99.7 /100 | #64 | Exceptional 98.0% |
| Immigrants | Northern Europe | 99.6 /100 | #65 | Exceptional 98.0% |
| Canadians | 99.6 /100 | #66 | Exceptional 98.0% |
| New Zealanders | 99.6 /100 | #67 | Exceptional 98.0% |
| Kiowa | 99.6 /100 | #68 | Exceptional 98.0% |