Sri Lankan vs Immigrants from Denmark 10th Grade

COMPARE

Sri Lankan
Race
Ancestry
AfghanAfricanAlaska NativeAlaskan AthabascanAlbanianAleutAlsatianAmericanApacheArabArapahoArgentineanArmenianAssyrian/Chaldean/SyriacAustralianAustrianBahamianBangladeshiBarbadianBasqueBelgianBelizeanBermudanBhutaneseBlackfeetBolivianBrazilianBritishBritish West IndianBulgarianBurmeseCajunCambodianCanadianCape VerdeanCarpatho RusynCelticCentral AmericanCentral American IndianCherokeeCheyenneChickasawChileanChineseChippewaChoctawColombianColvilleComancheCosta RicanCreeCreekCroatianCrowCubanCypriotCzechCzechoslovakianDanishDelawareDominicanDutchDutch West IndianEastern EuropeanEcuadorianEgyptianEnglishEstonianEthiopianEuropeanFijianFilipinoFinnishFrenchFrench American IndianFrench CanadianGermanGerman RussianGhanaianGreekGuamanian/ChamorroGuatemalanGuyaneseHaitianHmongHonduranHopiHoumaHungarianIcelanderIndian (Asian)IndonesianInupiatIranianIraqiIrishIroquoisIsraeliItalianJamaicanJapaneseJordanianKenyanKiowaKoreanLaotianLatvianLebaneseLiberianLithuanianLumbeeLuxembourgerMacedonianMalaysianMalteseMarshalleseMenomineeMexicanMexican American IndianMongolianMoroccanNative HawaiianNavajoNepaleseNew ZealanderNicaraguanNigerianNorthern EuropeanNorwegianOkinawanOsageOttawaPaiutePakistaniPalestinianPanamanianParaguayanPennsylvania GermanPeruvianPimaPolishPortuguesePotawatomiPuebloPuerto RicanPuget Sound SalishRomanianRussianSalvadoranSamoanScandinavianScotch-IrishScottishSeminoleSenegaleseSerbianShoshoneSierra LeoneanSiouxSlavicSlovakSloveneSomaliSouth AfricanSouth AmericanSouth American IndianSoviet UnionSpaniardSpanishSpanish AmericanSpanish American IndianSri LankanSubsaharan AfricanSudaneseSwedishSwissSyrianTaiwaneseThaiTlingit-HaidaTohono O'OdhamTonganTrinidadian and TobagonianTsimshianTurkishU.S. Virgin IslanderUgandanUkrainianUruguayanUteVenezuelanVietnameseWelshWest IndianYakamaYaquiYugoslavianYumanYup'ikZimbabwean
Immigration
NonimmigrantsImmigrantsAfghanistanAfricaAlbaniaArgentinaArmeniaAsiaAustraliaAustriaBahamasBangladeshBarbadosBelarusBelgiumBelizeBoliviaBosnia and HerzegovinaBrazilBulgariaBurma/MyanmarCabo VerdeCambodiaCameroonCanadaCaribbeanCentral AmericaChileChinaColombiaCongoCosta RicaCroatiaCubaCzechoslovakiaDominicaDominican RepublicEastern AfricaEastern AsiaEastern EuropeEcuadorEgyptEl SalvadorEnglandEritreaEthiopiaEuropeFijiFranceGermanyGhanaGreeceGrenadaGuatemalaGuyanaHaitiHondurasHong KongHungaryIndiaIndonesiaIranIraqIrelandIsraelItalyJamaicaJapanJordanKazakhstanKenyaKoreaKuwaitLaosLatin AmericaLatviaLebanonLiberiaLithuaniaMalaysiaMexicoMicronesiaMiddle AfricaMoldovaMoroccoNepalNetherlandsNicaraguaNigeriaNorth AmericaNorth MacedoniaNorthern AfricaNorthern EuropeNorwayOceaniaPakistanPanamaPeruPhilippinesPolandPortugalRomaniaRussiaSaudi ArabiaScotlandSenegalSerbiaSierra LeoneSingaporeSomaliaSouth AfricaSouth AmericaSouth Central AsiaSouth Eastern AsiaSouthern EuropeSpainSri LankaSt. Vincent and the GrenadinesSudanSwedenSwitzerlandSyriaTaiwanThailandTrinidad and TobagoTurkeyUgandaUkraineUruguayUzbekistanVenezuelaVietnamWest IndiesWestern AfricaWestern AsiaWestern EuropeYemenZaireZimbabweAzores
Immigrants from Denmark
Race
Ancestry
AfghanAfricanAlaska NativeAlaskan AthabascanAlbanianAleutAlsatianAmericanApacheArabArapahoArgentineanArmenianAssyrian/Chaldean/SyriacAustralianAustrianBahamianBangladeshiBarbadianBasqueBelgianBelizeanBermudanBhutaneseBlackfeetBolivianBrazilianBritishBritish West IndianBulgarianBurmeseCajunCambodianCanadianCape VerdeanCarpatho RusynCelticCentral AmericanCentral American IndianCherokeeCheyenneChickasawChileanChineseChippewaChoctawColombianColvilleComancheCosta RicanCreeCreekCroatianCrowCubanCypriotCzechCzechoslovakianDanishDelawareDominicanDutchDutch West IndianEastern EuropeanEcuadorianEgyptianEnglishEstonianEthiopianEuropeanFijianFilipinoFinnishFrenchFrench American IndianFrench CanadianGermanGerman RussianGhanaianGreekGuamanian/ChamorroGuatemalanGuyaneseHaitianHmongHonduranHopiHoumaHungarianIcelanderIndian (Asian)IndonesianInupiatIranianIraqiIrishIroquoisIsraeliItalianJamaicanJapaneseJordanianKenyanKiowaKoreanLaotianLatvianLebaneseLiberianLithuanianLumbeeLuxembourgerMacedonianMalaysianMalteseMarshalleseMenomineeMexicanMexican American IndianMongolianMoroccanNative HawaiianNavajoNepaleseNew ZealanderNicaraguanNigerianNorthern EuropeanNorwegianOkinawanOsageOttawaPaiutePakistaniPalestinianPanamanianParaguayanPennsylvania GermanPeruvianPimaPolishPortuguesePotawatomiPuebloPuerto RicanPuget Sound SalishRomanianRussianSalvadoranSamoanScandinavianScotch-IrishScottishSeminoleSenegaleseSerbianShoshoneSierra LeoneanSiouxSlavicSlovakSloveneSomaliSouth AfricanSouth AmericanSouth American IndianSoviet UnionSpaniardSpanishSpanish AmericanSpanish American IndianSubsaharan AfricanSudaneseSwedishSwissSyrianTaiwaneseThaiTlingit-HaidaTohono O'OdhamTonganTrinidadian and TobagonianTsimshianTurkishU.S. Virgin IslanderUgandanUkrainianUruguayanUteVenezuelanVietnameseWelshWest IndianYakamaYaquiYugoslavianYumanYup'ikZimbabwean
Immigration
NonimmigrantsImmigrantsAfghanistanAfricaAlbaniaArgentinaArmeniaAsiaAustraliaAustriaBahamasBangladeshBarbadosBelarusBelgiumBelizeBoliviaBosnia and HerzegovinaBrazilBulgariaBurma/MyanmarCabo VerdeCambodiaCameroonCanadaCaribbeanCentral AmericaChileChinaColombiaCongoCosta RicaCroatiaCubaCzechoslovakiaDenmarkDominicaDominican RepublicEastern AfricaEastern AsiaEastern EuropeEcuadorEgyptEl SalvadorEnglandEritreaEthiopiaEuropeFijiFranceGermanyGhanaGreeceGrenadaGuatemalaGuyanaHaitiHondurasHong KongHungaryIndiaIndonesiaIranIraqIrelandIsraelItalyJamaicaJapanJordanKazakhstanKenyaKoreaKuwaitLaosLatin AmericaLatviaLebanonLiberiaLithuaniaMalaysiaMexicoMicronesiaMiddle AfricaMoldovaMoroccoNepalNetherlandsNicaraguaNigeriaNorth AmericaNorth MacedoniaNorthern AfricaNorthern EuropeNorwayOceaniaPakistanPanamaPeruPhilippinesPolandPortugalRomaniaRussiaSaudi ArabiaScotlandSenegalSerbiaSierra LeoneSingaporeSomaliaSouth AfricaSouth AmericaSouth Central AsiaSouth Eastern AsiaSouthern EuropeSpainSri LankaSt. Vincent and the GrenadinesSudanSwedenSwitzerlandSyriaTaiwanThailandTrinidad and TobagoTurkeyUgandaUkraineUruguayUzbekistanVenezuelaVietnamWest IndiesWestern AfricaWestern AsiaWestern EuropeYemenZaireZimbabweAzores
10th Grade
Income
Poverty
Unemployment
Labor Participation
Family Structure
Vehicle Availability
Education Level
Disability

10th Grade Comparison

Sri Lankans

Immigrants from Denmark

Tragic
Exceptional
91.8%
10TH GRADE
0.0/ 100
METRIC RATING
289th/ 347
METRIC RANK
94.7%
10TH GRADE
99.2/ 100
METRIC RATING
80th/ 347
METRIC RANK

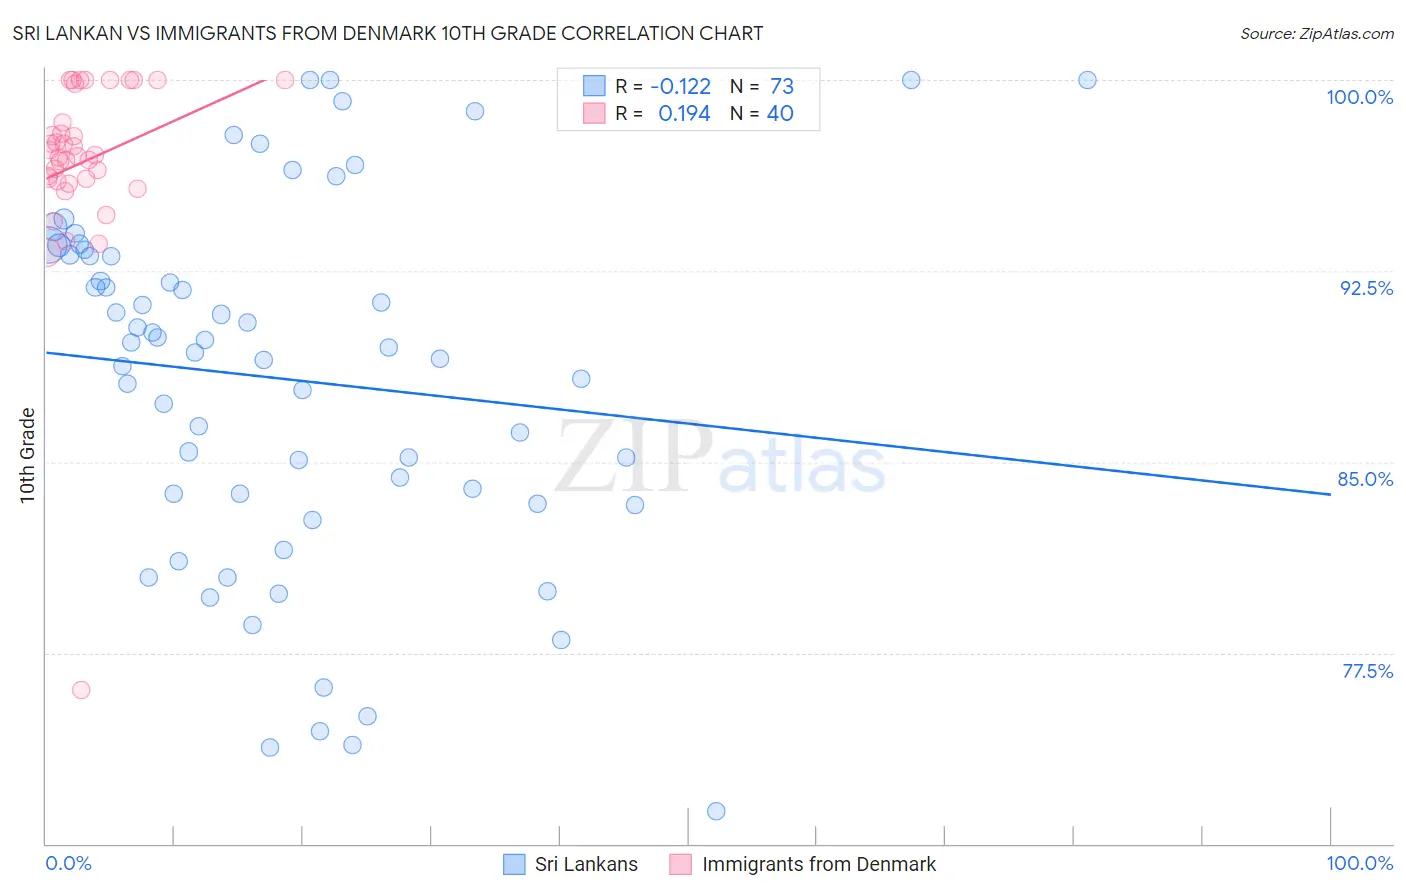
Sri Lankan vs Immigrants from Denmark 10th Grade Correlation Chart

The statistical analysis conducted on geographies consisting of 440,593,537 people shows a poor negative correlation between the proportion of Sri Lankans and percentage of population with at least 10th grade education in the United States with a correlation coefficient (R) of -0.122 and weighted average of 91.8%. Similarly, the statistical analysis conducted on geographies consisting of 136,430,715 people shows a poor positive correlation between the proportion of Immigrants from Denmark and percentage of population with at least 10th grade education in the United States with a correlation coefficient (R) of 0.194 and weighted average of 94.7%, a difference of 3.2%.
Sri Lankan vs Immigrants from Denmark 10th Grade

10th Grade Correlation Summary

MeasurementSri LankanImmigrants from Denmark
Minimum71.3%76.1%
Maximum100.0%100.0%
Range28.7%23.9%
Mean88.2%96.8%
Median89.5%97.0%
Interquartile 25% (IQ1)83.6%96.1%
Interquartile 75% (IQ3)93.2%99.1%
Interquartile Range (IQR)9.7%3.0%
Standard Deviation (Sample)7.1%3.9%
Standard Deviation (Population)7.0%3.8%

Similar Demographics by 10th Grade

Demographics Similar to Sri Lankans by 10th Grade

In terms of 10th grade, the demographic groups most similar to Sri Lankans are British West Indian (91.8%, a difference of 0.020%), Immigrants from West Indies (91.8%, a difference of 0.030%), Immigrants from Burma/Myanmar (91.8%, a difference of 0.030%), Pennsylvania German (91.9%, a difference of 0.040%), and Immigrants from Laos (91.9%, a difference of 0.040%).
DemographicsRating | Rank10th Grade
Immigrants | Peru
0.1
/100
|
#282
Tragic
92.2%
Immigrants | St. Vincent and the Grenadines
0.0
/100
|
#283
Tragic
92.1%
Immigrants | Barbados
0.0
/100
|
#284
Tragic
92.1%
Immigrants | South Eastern Asia
0.0
/100
|
#285
Tragic
92.1%
Yuman
0.0
/100
|
#286
Tragic
92.0%
Pennsylvania Germans
0.0
/100
|
#287
Tragic
91.9%
Immigrants | Laos
0.0
/100
|
#288
Tragic
91.9%
Sri Lankans
0.0
/100
|
#289
Tragic
91.8%
British West Indians
0.0
/100
|
#290
Tragic
91.8%
Immigrants | West Indies
0.0
/100
|
#291
Tragic
91.8%
Immigrants | Burma/Myanmar
0.0
/100
|
#292
Tragic
91.8%
Indonesians
0.0
/100
|
#293
Tragic
91.8%
Haitians
0.0
/100
|
#294
Tragic
91.8%
Lumbee
0.0
/100
|
#295
Tragic
91.7%
Immigrants | Grenada
0.0
/100
|
#296
Tragic
91.6%

Demographics Similar to Immigrants from Denmark by 10th Grade

In terms of 10th grade, the demographic groups most similar to Immigrants from Denmark are Immigrants from Latvia (94.7%, a difference of 0.0%), Immigrants from Czechoslovakia (94.7%, a difference of 0.010%), Swiss (94.7%, a difference of 0.030%), Immigrants from Western Europe (94.7%, a difference of 0.030%), and Filipino (94.8%, a difference of 0.040%).
DemographicsRating | Rank10th Grade
Bhutanese
99.6
/100
|
#73
Exceptional
94.9%
Canadians
99.6
/100
|
#74
Exceptional
94.9%
Okinawans
99.5
/100
|
#75
Exceptional
94.8%
Romanians
99.5
/100
|
#76
Exceptional
94.8%
Immigrants | South Africa
99.5
/100
|
#77
Exceptional
94.8%
Filipinos
99.3
/100
|
#78
Exceptional
94.8%
Immigrants | Czechoslovakia
99.2
/100
|
#79
Exceptional
94.7%
Immigrants | Denmark
99.2
/100
|
#80
Exceptional
94.7%
Immigrants | Latvia
99.2
/100
|
#81
Exceptional
94.7%
Swiss
99.1
/100
|
#82
Exceptional
94.7%
Immigrants | Western Europe
99.1
/100
|
#83
Exceptional
94.7%
Icelanders
99.1
/100
|
#84
Exceptional
94.7%
Crow
99.0
/100
|
#85
Exceptional
94.7%
Puget Sound Salish
99.0
/100
|
#86
Exceptional
94.7%
Immigrants | Saudi Arabia
99.0
/100
|
#87
Exceptional
94.7%