Estonian vs Immigrants from Canada 9th Grade
COMPARE
Estonian
Immigrants from Canada
9th Grade
9th Grade Comparison
Estonians
Immigrants from Canada
96.1%
9TH GRADE
99.9/ 100
METRIC RATING
37th/ 347
METRIC RANK
96.0%
9TH GRADE
99.8/ 100
METRIC RATING
54th/ 347
METRIC RANK
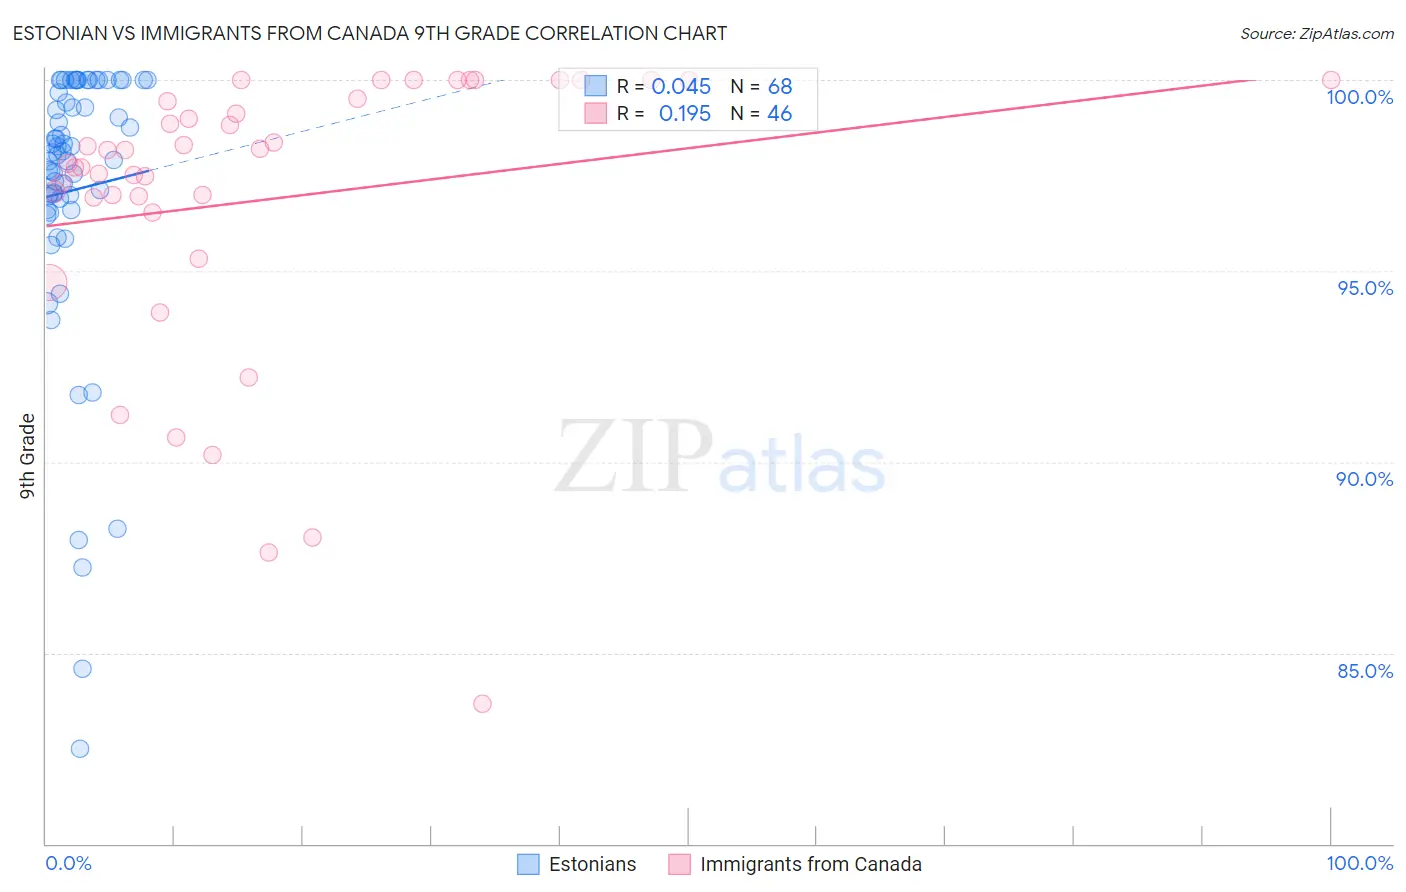
Estonian vs Immigrants from Canada 9th Grade Correlation Chart
The statistical analysis conducted on geographies consisting of 123,528,404 people shows no correlation between the proportion of Estonians and percentage of population with at least 9th grade education in the United States with a correlation coefficient (R) of 0.045 and weighted average of 96.1%. Similarly, the statistical analysis conducted on geographies consisting of 459,397,383 people shows a poor positive correlation between the proportion of Immigrants from Canada and percentage of population with at least 9th grade education in the United States with a correlation coefficient (R) of 0.195 and weighted average of 96.0%, a difference of 0.16%.
9th Grade Correlation Summary
| Measurement | Estonian | Immigrants from Canada |
| Minimum | 82.5% | 83.7% |
| Maximum | 100.0% | 100.0% |
| Range | 17.5% | 16.3% |
| Mean | 97.1% | 96.9% |
| Median | 98.1% | 98.0% |
| Interquartile 25% (IQ1) | 96.7% | 96.9% |
| Interquartile 75% (IQ3) | 99.8% | 99.5% |
| Interquartile Range (IQR) | 3.1% | 2.6% |
| Standard Deviation (Sample) | 3.7% | 3.8% |
| Standard Deviation (Population) | 3.7% | 3.7% |
Demographics Similar to Estonians and Immigrants from Canada by 9th Grade
In terms of 9th grade, the demographic groups most similar to Estonians are Immigrants from Scotland (96.1%, a difference of 0.0%), Ottawa (96.1%, a difference of 0.020%), Northern European (96.2%, a difference of 0.040%), Slavic (96.1%, a difference of 0.040%), and Bulgarian (96.2%, a difference of 0.050%). Similarly, the demographic groups most similar to Immigrants from Canada are Austrian (96.0%, a difference of 0.010%), Immigrants from Austria (96.0%, a difference of 0.010%), Serbian (96.0%, a difference of 0.020%), Immigrants from Northern Europe (96.0%, a difference of 0.030%), and Celtic (96.0%, a difference of 0.040%).
| Demographics | Rating | Rank | 9th Grade |
| Bulgarians | 99.9 /100 | #35 | Exceptional 96.2% |
| Northern Europeans | 99.9 /100 | #36 | Exceptional 96.2% |
| Estonians | 99.9 /100 | #37 | Exceptional 96.1% |
| Immigrants | Scotland | 99.9 /100 | #38 | Exceptional 96.1% |
| Ottawa | 99.9 /100 | #39 | Exceptional 96.1% |
| Slavs | 99.9 /100 | #40 | Exceptional 96.1% |
| Czechoslovakians | 99.9 /100 | #41 | Exceptional 96.1% |
| Chippewa | 99.9 /100 | #42 | Exceptional 96.1% |
| Iranians | 99.9 /100 | #43 | Exceptional 96.1% |
| Alaska Natives | 99.9 /100 | #44 | Exceptional 96.1% |
| Crow | 99.9 /100 | #45 | Exceptional 96.1% |
| Immigrants | India | 99.9 /100 | #46 | Exceptional 96.1% |
| Russians | 99.9 /100 | #47 | Exceptional 96.0% |
| Australians | 99.9 /100 | #48 | Exceptional 96.0% |
| Greeks | 99.9 /100 | #49 | Exceptional 96.0% |
| Celtics | 99.9 /100 | #50 | Exceptional 96.0% |
| Immigrants | Northern Europe | 99.9 /100 | #51 | Exceptional 96.0% |
| Serbians | 99.9 /100 | #52 | Exceptional 96.0% |
| Austrians | 99.8 /100 | #53 | Exceptional 96.0% |
| Immigrants | Canada | 99.8 /100 | #54 | Exceptional 96.0% |
| Immigrants | Austria | 99.8 /100 | #55 | Exceptional 96.0% |