Immigrants from Northern Europe vs Eastern European High School Diploma
COMPARE
Immigrants from Northern Europe
Eastern European
High School Diploma
High School Diploma Comparison
Immigrants from Northern Europe
Eastern Europeans
91.4%
HIGH SCHOOL DIPLOMA
99.9/ 100
METRIC RATING
31st/ 347
METRIC RANK
91.9%
HIGH SCHOOL DIPLOMA
100.0/ 100
METRIC RATING
11th/ 347
METRIC RANK
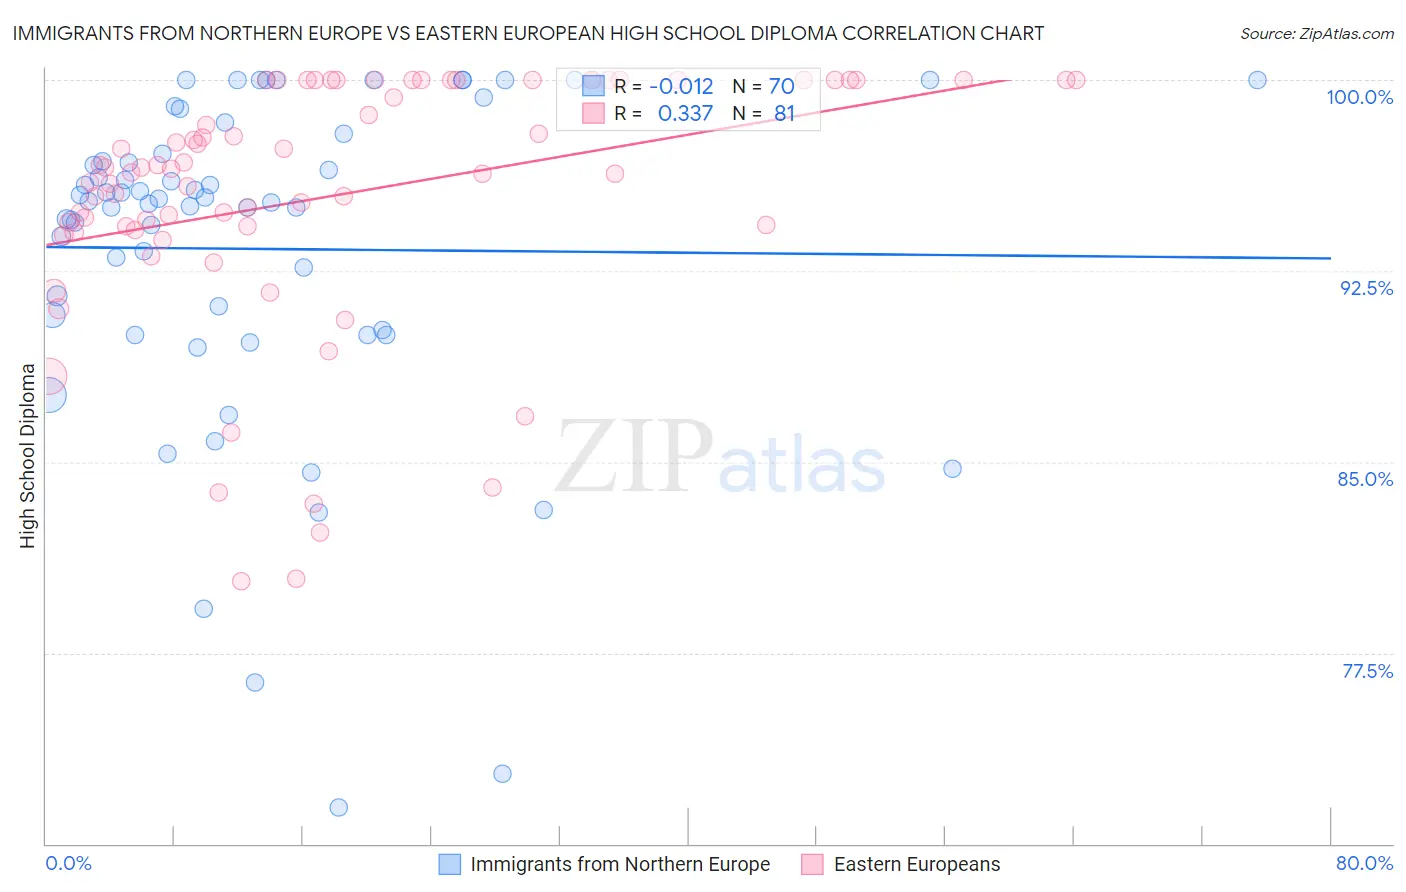
Immigrants from Northern Europe vs Eastern European High School Diploma Correlation Chart
The statistical analysis conducted on geographies consisting of 477,226,871 people shows no correlation between the proportion of Immigrants from Northern Europe and percentage of population with at least high school diploma education in the United States with a correlation coefficient (R) of -0.012 and weighted average of 91.4%. Similarly, the statistical analysis conducted on geographies consisting of 461,247,615 people shows a mild positive correlation between the proportion of Eastern Europeans and percentage of population with at least high school diploma education in the United States with a correlation coefficient (R) of 0.337 and weighted average of 91.9%, a difference of 0.54%.
High School Diploma Correlation Summary
| Measurement | Immigrants from Northern Europe | Eastern European |
| Minimum | 71.4% | 80.3% |
| Maximum | 100.0% | 100.0% |
| Range | 28.6% | 19.7% |
| Mean | 93.4% | 95.5% |
| Median | 95.2% | 96.5% |
| Interquartile 25% (IQ1) | 90.2% | 94.2% |
| Interquartile 75% (IQ3) | 97.1% | 100.0% |
| Interquartile Range (IQR) | 6.9% | 5.8% |
| Standard Deviation (Sample) | 6.4% | 5.0% |
| Standard Deviation (Population) | 6.4% | 4.9% |
Demographics Similar to Immigrants from Northern Europe and Eastern Europeans by High School Diploma
In terms of high school diploma, the demographic groups most similar to Immigrants from Northern Europe are European (91.4%, a difference of 0.010%), Iranian (91.4%, a difference of 0.010%), Tlingit-Haida (91.4%, a difference of 0.030%), Cypriot (91.5%, a difference of 0.070%), and Russian (91.5%, a difference of 0.080%). Similarly, the demographic groups most similar to Eastern Europeans are Polish (91.9%, a difference of 0.050%), Danish (91.8%, a difference of 0.090%), Bulgarian (91.8%, a difference of 0.15%), Luxembourger (91.7%, a difference of 0.18%), and Finnish (91.7%, a difference of 0.19%).
| Demographics | Rating | Rank | High School Diploma |
| Eastern Europeans | 100.0 /100 | #11 | Exceptional 91.9% |
| Poles | 100.0 /100 | #12 | Exceptional 91.9% |
| Danes | 100.0 /100 | #13 | Exceptional 91.8% |
| Bulgarians | 100.0 /100 | #14 | Exceptional 91.8% |
| Luxembourgers | 100.0 /100 | #15 | Exceptional 91.7% |
| Finns | 100.0 /100 | #16 | Exceptional 91.7% |
| Immigrants | Singapore | 99.9 /100 | #17 | Exceptional 91.7% |
| Germans | 99.9 /100 | #18 | Exceptional 91.7% |
| Maltese | 99.9 /100 | #19 | Exceptional 91.6% |
| Czechs | 99.9 /100 | #20 | Exceptional 91.6% |
| Filipinos | 99.9 /100 | #21 | Exceptional 91.6% |
| Estonians | 99.9 /100 | #22 | Exceptional 91.6% |
| Scandinavians | 99.9 /100 | #23 | Exceptional 91.5% |
| Italians | 99.9 /100 | #24 | Exceptional 91.5% |
| Thais | 99.9 /100 | #25 | Exceptional 91.5% |
| Russians | 99.9 /100 | #26 | Exceptional 91.5% |
| Cypriots | 99.9 /100 | #27 | Exceptional 91.5% |
| Tlingit-Haida | 99.9 /100 | #28 | Exceptional 91.4% |
| Europeans | 99.9 /100 | #29 | Exceptional 91.4% |
| Iranians | 99.9 /100 | #30 | Exceptional 91.4% |
| Immigrants | Northern Europe | 99.9 /100 | #31 | Exceptional 91.4% |