Ottawa vs Eastern European High School Diploma
COMPARE
Ottawa
Eastern European
High School Diploma
High School Diploma Comparison
Ottawa
Eastern Europeans
90.1%
HIGH SCHOOL DIPLOMA
94.4/ 100
METRIC RATING
120th/ 347
METRIC RANK
91.9%
HIGH SCHOOL DIPLOMA
100.0/ 100
METRIC RATING
11th/ 347
METRIC RANK
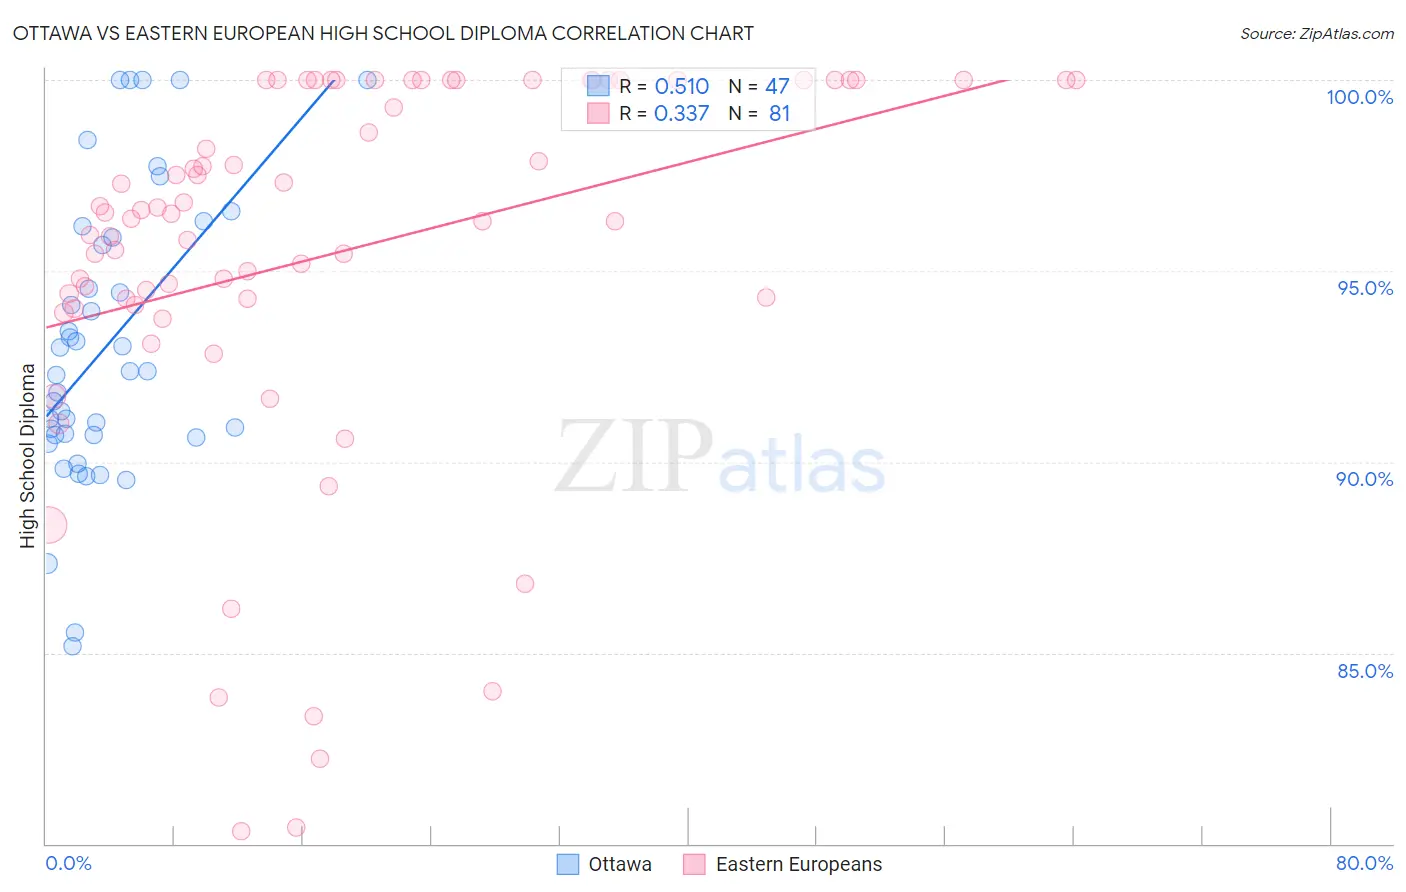
Ottawa vs Eastern European High School Diploma Correlation Chart
The statistical analysis conducted on geographies consisting of 49,956,602 people shows a substantial positive correlation between the proportion of Ottawa and percentage of population with at least high school diploma education in the United States with a correlation coefficient (R) of 0.510 and weighted average of 90.1%. Similarly, the statistical analysis conducted on geographies consisting of 461,247,615 people shows a mild positive correlation between the proportion of Eastern Europeans and percentage of population with at least high school diploma education in the United States with a correlation coefficient (R) of 0.337 and weighted average of 91.9%, a difference of 2.0%.
High School Diploma Correlation Summary
| Measurement | Ottawa | Eastern European |
| Minimum | 85.2% | 80.3% |
| Maximum | 100.0% | 100.0% |
| Range | 14.8% | 19.7% |
| Mean | 93.1% | 95.5% |
| Median | 92.4% | 96.5% |
| Interquartile 25% (IQ1) | 90.7% | 94.2% |
| Interquartile 75% (IQ3) | 95.9% | 100.0% |
| Interquartile Range (IQR) | 5.2% | 5.8% |
| Standard Deviation (Sample) | 3.7% | 5.0% |
| Standard Deviation (Population) | 3.7% | 4.9% |
Similar Demographics by High School Diploma
Demographics Similar to Ottawa by High School Diploma
In terms of high school diploma, the demographic groups most similar to Ottawa are White/Caucasian (90.1%, a difference of 0.020%), Immigrants from Eastern Europe (90.1%, a difference of 0.030%), Israeli (90.1%, a difference of 0.050%), Jordanian (90.2%, a difference of 0.070%), and Immigrants from Kazakhstan (90.0%, a difference of 0.070%).
| Demographics | Rating | Rank | High School Diploma |
| Immigrants | Sri Lanka | 96.3 /100 | #113 | Exceptional 90.2% |
| Yugoslavians | 96.2 /100 | #114 | Exceptional 90.2% |
| Immigrants | Hungary | 95.8 /100 | #115 | Exceptional 90.2% |
| Immigrants | Germany | 95.7 /100 | #116 | Exceptional 90.2% |
| Jordanians | 95.4 /100 | #117 | Exceptional 90.2% |
| Israelis | 95.1 /100 | #118 | Exceptional 90.1% |
| Immigrants | Eastern Europe | 94.9 /100 | #119 | Exceptional 90.1% |
| Ottawa | 94.4 /100 | #120 | Exceptional 90.1% |
| Whites/Caucasians | 94.1 /100 | #121 | Exceptional 90.1% |
| Immigrants | Kazakhstan | 93.4 /100 | #122 | Exceptional 90.0% |
| German Russians | 92.0 /100 | #123 | Exceptional 90.0% |
| Mongolians | 91.6 /100 | #124 | Exceptional 89.9% |
| Egyptians | 91.1 /100 | #125 | Exceptional 89.9% |
| Alaska Natives | 91.0 /100 | #126 | Exceptional 89.9% |
| Immigrants | Eastern Asia | 89.2 /100 | #127 | Excellent 89.9% |
Demographics Similar to Eastern Europeans by High School Diploma
In terms of high school diploma, the demographic groups most similar to Eastern Europeans are Polish (91.9%, a difference of 0.050%), Croatian (92.0%, a difference of 0.070%), Danish (91.8%, a difference of 0.090%), Latvian (92.0%, a difference of 0.10%), and Chinese (92.0%, a difference of 0.11%).
| Demographics | Rating | Rank | High School Diploma |
| Lithuanians | 100.0 /100 | #4 | Exceptional 92.0% |
| Slovenes | 100.0 /100 | #5 | Exceptional 92.0% |
| Slovaks | 100.0 /100 | #6 | Exceptional 92.0% |
| Immigrants | India | 100.0 /100 | #7 | Exceptional 92.0% |
| Chinese | 100.0 /100 | #8 | Exceptional 92.0% |
| Latvians | 100.0 /100 | #9 | Exceptional 92.0% |
| Croatians | 100.0 /100 | #10 | Exceptional 92.0% |
| Eastern Europeans | 100.0 /100 | #11 | Exceptional 91.9% |
| Poles | 100.0 /100 | #12 | Exceptional 91.9% |
| Danes | 100.0 /100 | #13 | Exceptional 91.8% |
| Bulgarians | 100.0 /100 | #14 | Exceptional 91.8% |
| Luxembourgers | 100.0 /100 | #15 | Exceptional 91.7% |
| Finns | 100.0 /100 | #16 | Exceptional 91.7% |
| Immigrants | Singapore | 99.9 /100 | #17 | Exceptional 91.7% |
| Germans | 99.9 /100 | #18 | Exceptional 91.7% |