Immigrants from Costa Rica vs Osage 11th Grade
COMPARE
Immigrants from Costa Rica
Osage
11th Grade
11th Grade Comparison
Immigrants from Costa Rica
Osage
91.4%
11TH GRADE
0.9/ 100
METRIC RATING
251st/ 347
METRIC RANK
92.7%
11TH GRADE
73.4/ 100
METRIC RATING
154th/ 347
METRIC RANK
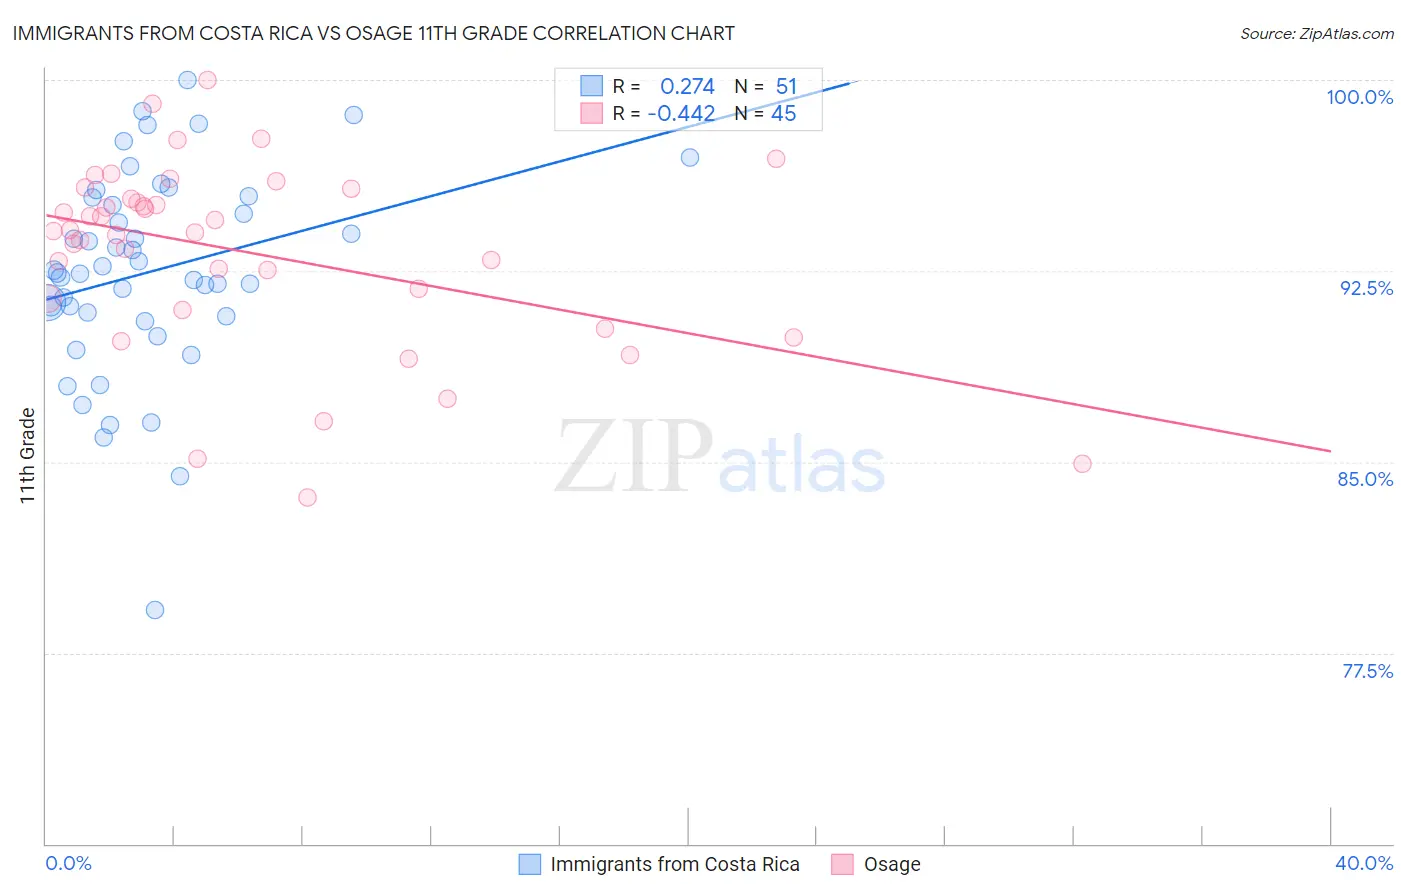
Immigrants from Costa Rica vs Osage 11th Grade Correlation Chart
The statistical analysis conducted on geographies consisting of 204,277,241 people shows a weak positive correlation between the proportion of Immigrants from Costa Rica and percentage of population with at least 11th grade education in the United States with a correlation coefficient (R) of 0.274 and weighted average of 91.4%. Similarly, the statistical analysis conducted on geographies consisting of 91,808,929 people shows a moderate negative correlation between the proportion of Osage and percentage of population with at least 11th grade education in the United States with a correlation coefficient (R) of -0.442 and weighted average of 92.7%, a difference of 1.4%.
11th Grade Correlation Summary
| Measurement | Immigrants from Costa Rica | Osage |
| Minimum | 79.2% | 83.6% |
| Maximum | 100.0% | 100.0% |
| Range | 20.8% | 16.4% |
| Mean | 92.5% | 93.2% |
| Median | 92.4% | 94.1% |
| Interquartile 25% (IQ1) | 90.7% | 91.2% |
| Interquartile 75% (IQ3) | 95.4% | 95.5% |
| Interquartile Range (IQR) | 4.7% | 4.3% |
| Standard Deviation (Sample) | 4.0% | 3.7% |
| Standard Deviation (Population) | 4.0% | 3.6% |
Similar Demographics by 11th Grade
Demographics Similar to Immigrants from Costa Rica by 11th Grade
In terms of 11th grade, the demographic groups most similar to Immigrants from Costa Rica are Immigrants from Nigeria (91.4%, a difference of 0.010%), Peruvian (91.5%, a difference of 0.020%), Ghanaian (91.5%, a difference of 0.020%), Immigrants from South America (91.4%, a difference of 0.020%), and Immigrants from Philippines (91.5%, a difference of 0.030%).
| Demographics | Rating | Rank | 11th Grade |
| Senegalese | 1.4 /100 | #244 | Tragic 91.6% |
| Africans | 1.3 /100 | #245 | Tragic 91.5% |
| Seminole | 1.2 /100 | #246 | Tragic 91.5% |
| Immigrants | Philippines | 1.0 /100 | #247 | Tragic 91.5% |
| Immigrants | Uzbekistan | 1.0 /100 | #248 | Tragic 91.5% |
| Peruvians | 1.0 /100 | #249 | Tragic 91.5% |
| Ghanaians | 0.9 /100 | #250 | Tragic 91.5% |
| Immigrants | Costa Rica | 0.9 /100 | #251 | Tragic 91.4% |
| Immigrants | Nigeria | 0.8 /100 | #252 | Tragic 91.4% |
| Immigrants | South America | 0.8 /100 | #253 | Tragic 91.4% |
| Immigrants | Eritrea | 0.7 /100 | #254 | Tragic 91.4% |
| Blacks/African Americans | 0.7 /100 | #255 | Tragic 91.4% |
| Immigrants | Senegal | 0.7 /100 | #256 | Tragic 91.4% |
| Cajuns | 0.7 /100 | #257 | Tragic 91.4% |
| Immigrants | Colombia | 0.6 /100 | #258 | Tragic 91.4% |
Demographics Similar to Osage by 11th Grade
In terms of 11th grade, the demographic groups most similar to Osage are Argentinean (92.7%, a difference of 0.0%), Immigrants from Spain (92.7%, a difference of 0.0%), Potawatomi (92.8%, a difference of 0.010%), Iraqi (92.8%, a difference of 0.010%), and Brazilian (92.8%, a difference of 0.010%).
| Demographics | Rating | Rank | 11th Grade |
| Immigrants | Kenya | 78.7 /100 | #147 | Good 92.8% |
| Hmong | 78.6 /100 | #148 | Good 92.8% |
| Immigrants | Poland | 78.5 /100 | #149 | Good 92.8% |
| Immigrants | Egypt | 77.5 /100 | #150 | Good 92.8% |
| Potawatomi | 74.3 /100 | #151 | Good 92.8% |
| Iraqis | 74.2 /100 | #152 | Good 92.8% |
| Brazilians | 73.9 /100 | #153 | Good 92.8% |
| Osage | 73.4 /100 | #154 | Good 92.7% |
| Argentineans | 73.4 /100 | #155 | Good 92.7% |
| Immigrants | Spain | 73.0 /100 | #156 | Good 92.7% |
| Immigrants | Eastern Asia | 72.6 /100 | #157 | Good 92.7% |
| Immigrants | Venezuela | 72.0 /100 | #158 | Good 92.7% |
| Americans | 71.7 /100 | #159 | Good 92.7% |
| Immigrants | Lebanon | 70.7 /100 | #160 | Good 92.7% |
| Immigrants | Argentina | 69.8 /100 | #161 | Good 92.7% |