Chinese vs Osage 11th Grade
COMPARE
Chinese
Osage
11th Grade
11th Grade Comparison
Chinese
Osage
94.6%
11TH GRADE
100.0/ 100
METRIC RATING
13th/ 347
METRIC RANK
92.7%
11TH GRADE
73.4/ 100
METRIC RATING
154th/ 347
METRIC RANK
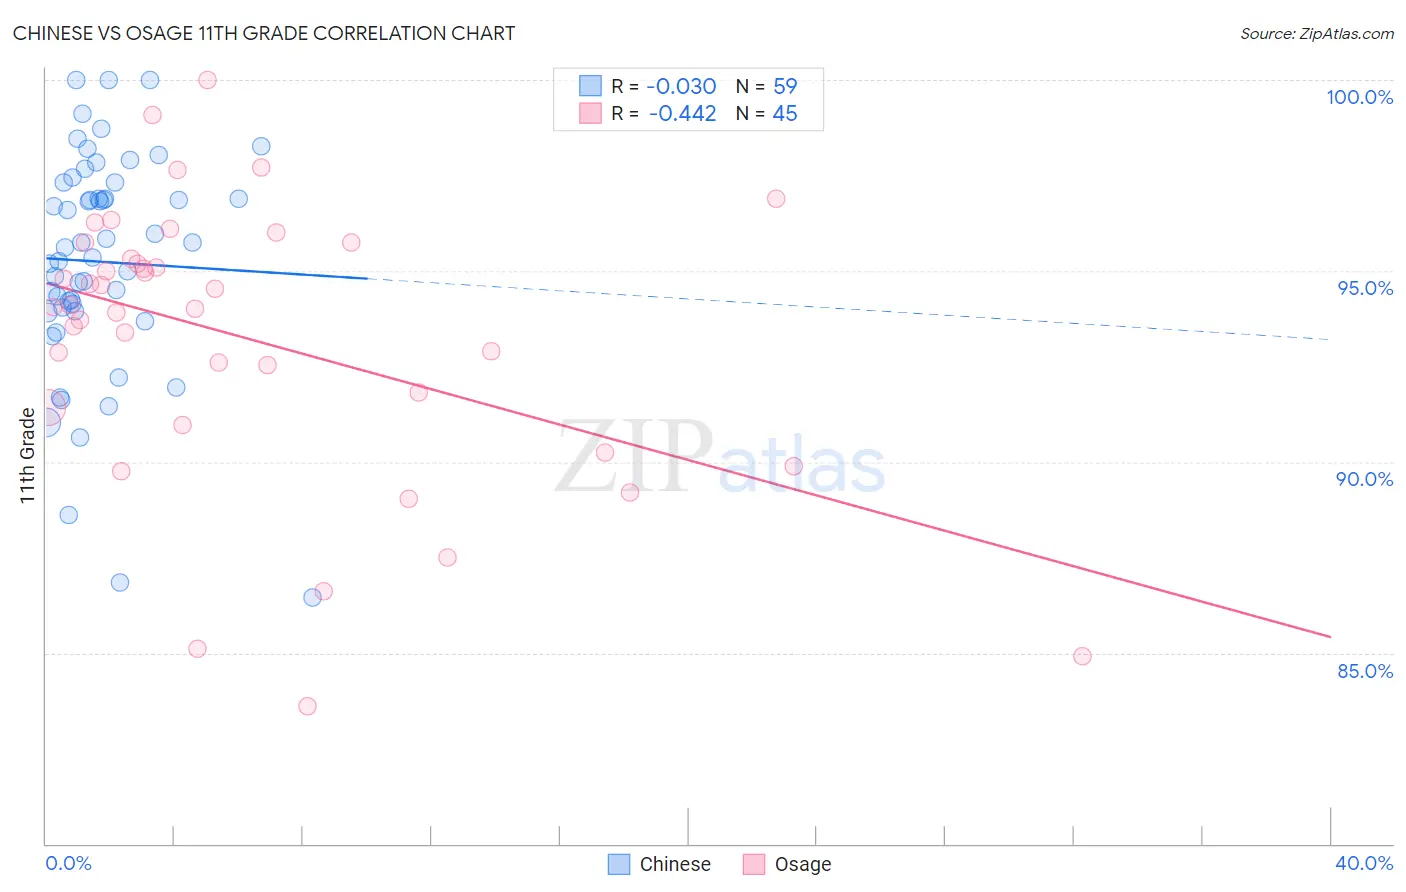
Chinese vs Osage 11th Grade Correlation Chart
The statistical analysis conducted on geographies consisting of 64,809,883 people shows no correlation between the proportion of Chinese and percentage of population with at least 11th grade education in the United States with a correlation coefficient (R) of -0.030 and weighted average of 94.6%. Similarly, the statistical analysis conducted on geographies consisting of 91,808,929 people shows a moderate negative correlation between the proportion of Osage and percentage of population with at least 11th grade education in the United States with a correlation coefficient (R) of -0.442 and weighted average of 92.7%, a difference of 2.0%.
11th Grade Correlation Summary
| Measurement | Chinese | Osage |
| Minimum | 86.4% | 83.6% |
| Maximum | 100.0% | 100.0% |
| Range | 13.6% | 16.4% |
| Mean | 95.2% | 93.2% |
| Median | 95.6% | 94.1% |
| Interquartile 25% (IQ1) | 93.9% | 91.2% |
| Interquartile 75% (IQ3) | 97.3% | 95.5% |
| Interquartile Range (IQR) | 3.4% | 4.3% |
| Standard Deviation (Sample) | 2.9% | 3.7% |
| Standard Deviation (Population) | 2.9% | 3.6% |
Similar Demographics by 11th Grade
Demographics Similar to Chinese by 11th Grade
In terms of 11th grade, the demographic groups most similar to Chinese are German (94.7%, a difference of 0.030%), Latvian (94.7%, a difference of 0.030%), Finnish (94.7%, a difference of 0.040%), Eastern European (94.6%, a difference of 0.060%), and Danish (94.7%, a difference of 0.080%).
| Demographics | Rating | Rank | 11th Grade |
| Lithuanians | 100.0 /100 | #6 | Exceptional 94.8% |
| Poles | 100.0 /100 | #7 | Exceptional 94.8% |
| Croatians | 100.0 /100 | #8 | Exceptional 94.7% |
| Danes | 100.0 /100 | #9 | Exceptional 94.7% |
| Finns | 100.0 /100 | #10 | Exceptional 94.7% |
| Germans | 100.0 /100 | #11 | Exceptional 94.7% |
| Latvians | 100.0 /100 | #12 | Exceptional 94.7% |
| Chinese | 100.0 /100 | #13 | Exceptional 94.6% |
| Eastern Europeans | 100.0 /100 | #14 | Exceptional 94.6% |
| Bulgarians | 100.0 /100 | #15 | Exceptional 94.5% |
| Immigrants | India | 100.0 /100 | #16 | Exceptional 94.5% |
| Luxembourgers | 100.0 /100 | #17 | Exceptional 94.5% |
| Maltese | 100.0 /100 | #18 | Exceptional 94.5% |
| Scandinavians | 100.0 /100 | #19 | Exceptional 94.5% |
| Italians | 100.0 /100 | #20 | Exceptional 94.5% |
Demographics Similar to Osage by 11th Grade
In terms of 11th grade, the demographic groups most similar to Osage are Argentinean (92.7%, a difference of 0.0%), Immigrants from Spain (92.7%, a difference of 0.0%), Potawatomi (92.8%, a difference of 0.010%), Iraqi (92.8%, a difference of 0.010%), and Brazilian (92.8%, a difference of 0.010%).
| Demographics | Rating | Rank | 11th Grade |
| Immigrants | Kenya | 78.7 /100 | #147 | Good 92.8% |
| Hmong | 78.6 /100 | #148 | Good 92.8% |
| Immigrants | Poland | 78.5 /100 | #149 | Good 92.8% |
| Immigrants | Egypt | 77.5 /100 | #150 | Good 92.8% |
| Potawatomi | 74.3 /100 | #151 | Good 92.8% |
| Iraqis | 74.2 /100 | #152 | Good 92.8% |
| Brazilians | 73.9 /100 | #153 | Good 92.8% |
| Osage | 73.4 /100 | #154 | Good 92.7% |
| Argentineans | 73.4 /100 | #155 | Good 92.7% |
| Immigrants | Spain | 73.0 /100 | #156 | Good 92.7% |
| Immigrants | Eastern Asia | 72.6 /100 | #157 | Good 92.7% |
| Immigrants | Venezuela | 72.0 /100 | #158 | Good 92.7% |
| Americans | 71.7 /100 | #159 | Good 92.7% |
| Immigrants | Lebanon | 70.7 /100 | #160 | Good 92.7% |
| Immigrants | Argentina | 69.8 /100 | #161 | Good 92.7% |