Central American Indian vs Okinawan Professional Degree
COMPARE
Central American Indian
Okinawan
Professional Degree
Professional Degree Comparison
Central American Indians
Okinawans
3.6%
PROFESSIONAL DEGREE
0.8/ 100
METRIC RATING
266th/ 347
METRIC RANK
7.3%
PROFESSIONAL DEGREE
100.0/ 100
METRIC RATING
6th/ 347
METRIC RANK
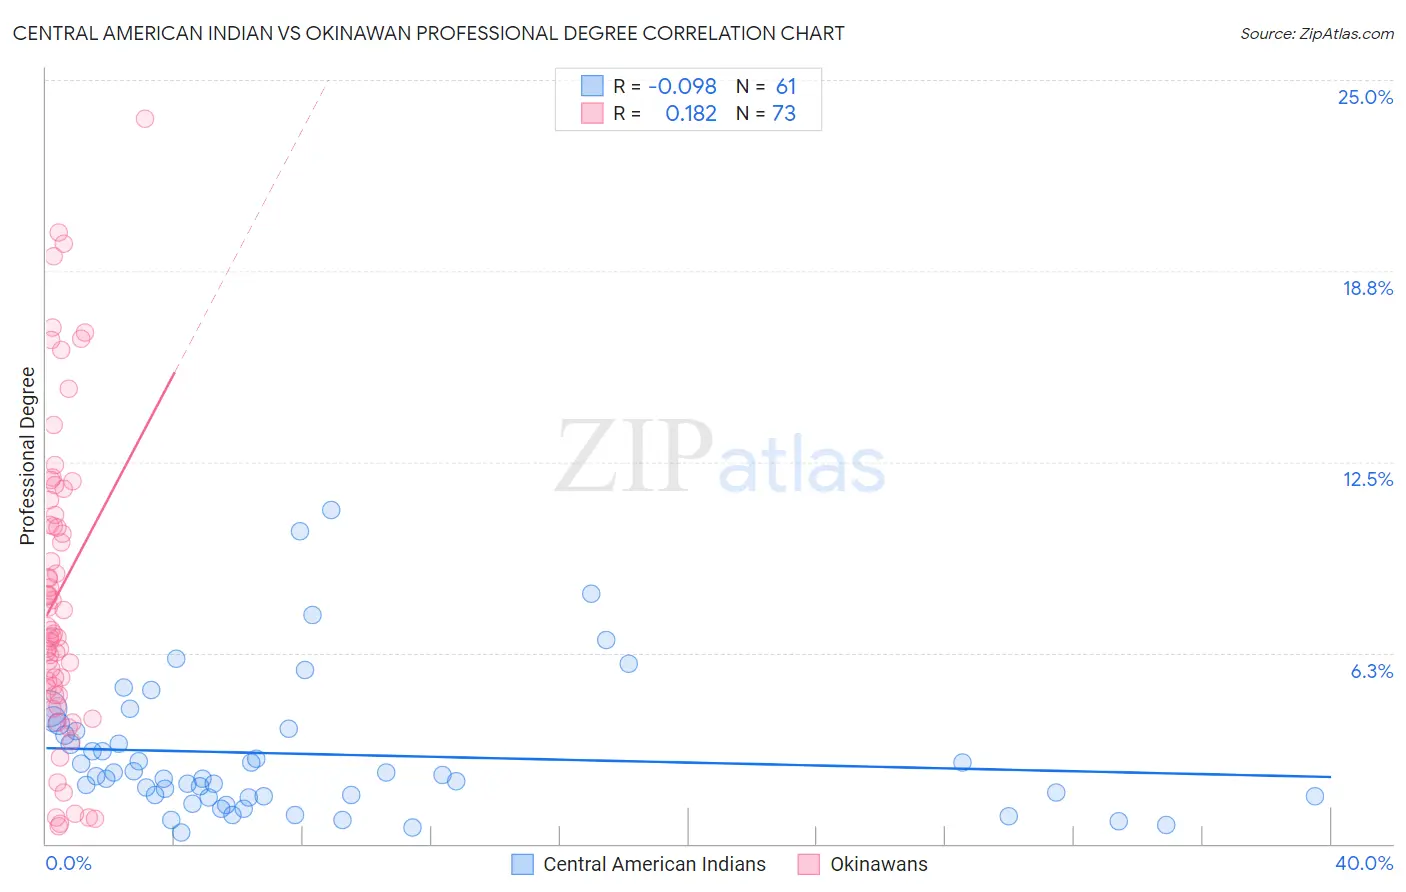
Central American Indian vs Okinawan Professional Degree Correlation Chart
The statistical analysis conducted on geographies consisting of 325,494,911 people shows a slight negative correlation between the proportion of Central American Indians and percentage of population with at least professional degree education in the United States with a correlation coefficient (R) of -0.098 and weighted average of 3.6%. Similarly, the statistical analysis conducted on geographies consisting of 73,726,679 people shows a poor positive correlation between the proportion of Okinawans and percentage of population with at least professional degree education in the United States with a correlation coefficient (R) of 0.182 and weighted average of 7.3%, a difference of 101.5%.
Professional Degree Correlation Summary
| Measurement | Central American Indian | Okinawan |
| Minimum | 0.37% | 0.58% |
| Maximum | 10.9% | 23.7% |
| Range | 10.5% | 23.1% |
| Mean | 2.9% | 8.3% |
| Median | 2.2% | 7.0% |
| Interquartile 25% (IQ1) | 1.5% | 5.0% |
| Interquartile 75% (IQ3) | 3.7% | 11.0% |
| Interquartile Range (IQR) | 2.2% | 6.0% |
| Standard Deviation (Sample) | 2.2% | 5.1% |
| Standard Deviation (Population) | 2.2% | 5.0% |
Similar Demographics by Professional Degree
Demographics Similar to Central American Indians by Professional Degree
In terms of professional degree, the demographic groups most similar to Central American Indians are Delaware (3.6%, a difference of 0.26%), Immigrants from Congo (3.6%, a difference of 0.32%), Immigrants from Cambodia (3.6%, a difference of 0.36%), Hopi (3.6%, a difference of 0.38%), and Aleut (3.6%, a difference of 0.42%).
| Demographics | Rating | Rank | Professional Degree |
| Africans | 1.0 /100 | #259 | Tragic 3.7% |
| Indonesians | 1.0 /100 | #260 | Tragic 3.7% |
| Immigrants | Guyana | 1.0 /100 | #261 | Tragic 3.7% |
| U.S. Virgin Islanders | 1.0 /100 | #262 | Tragic 3.7% |
| Hopi | 0.9 /100 | #263 | Tragic 3.6% |
| Immigrants | Cambodia | 0.9 /100 | #264 | Tragic 3.6% |
| Immigrants | Congo | 0.8 /100 | #265 | Tragic 3.6% |
| Central American Indians | 0.8 /100 | #266 | Tragic 3.6% |
| Delaware | 0.7 /100 | #267 | Tragic 3.6% |
| Aleuts | 0.7 /100 | #268 | Tragic 3.6% |
| Immigrants | Cuba | 0.6 /100 | #269 | Tragic 3.6% |
| Central Americans | 0.6 /100 | #270 | Tragic 3.6% |
| Belizeans | 0.5 /100 | #271 | Tragic 3.6% |
| Immigrants | Jamaica | 0.5 /100 | #272 | Tragic 3.6% |
| Americans | 0.5 /100 | #273 | Tragic 3.6% |
Demographics Similar to Okinawans by Professional Degree
In terms of professional degree, the demographic groups most similar to Okinawans are Immigrants from Iran (7.3%, a difference of 0.11%), Eastern European (7.1%, a difference of 3.2%), Immigrants from Switzerland (7.1%, a difference of 3.3%), Filipino (7.6%, a difference of 3.4%), and Immigrants from Taiwan (7.1%, a difference of 3.5%).
| Demographics | Rating | Rank | Professional Degree |
| Immigrants | Israel | 100.0 /100 | #1 | Exceptional 7.9% |
| Immigrants | Singapore | 100.0 /100 | #2 | Exceptional 7.7% |
| Iranians | 100.0 /100 | #3 | Exceptional 7.6% |
| Filipinos | 100.0 /100 | #4 | Exceptional 7.6% |
| Immigrants | Iran | 100.0 /100 | #5 | Exceptional 7.3% |
| Okinawans | 100.0 /100 | #6 | Exceptional 7.3% |
| Eastern Europeans | 100.0 /100 | #7 | Exceptional 7.1% |
| Immigrants | Switzerland | 100.0 /100 | #8 | Exceptional 7.1% |
| Immigrants | Taiwan | 100.0 /100 | #9 | Exceptional 7.1% |
| Immigrants | Belgium | 100.0 /100 | #10 | Exceptional 7.0% |
| Cypriots | 100.0 /100 | #11 | Exceptional 6.9% |
| Israelis | 100.0 /100 | #12 | Exceptional 6.9% |
| Immigrants | Australia | 100.0 /100 | #13 | Exceptional 6.9% |
| Immigrants | France | 100.0 /100 | #14 | Exceptional 6.8% |
| Immigrants | China | 100.0 /100 | #15 | Exceptional 6.7% |