Egyptian vs Immigrants from Oceania 7th Grade
COMPARE
Egyptian
Immigrants from Oceania
7th Grade
7th Grade Comparison
Egyptians
Immigrants from Oceania
96.1%
7TH GRADE
54.2/ 100
METRIC RATING
171st/ 347
METRIC RANK
95.7%
7TH GRADE
6.7/ 100
METRIC RATING
224th/ 347
METRIC RANK
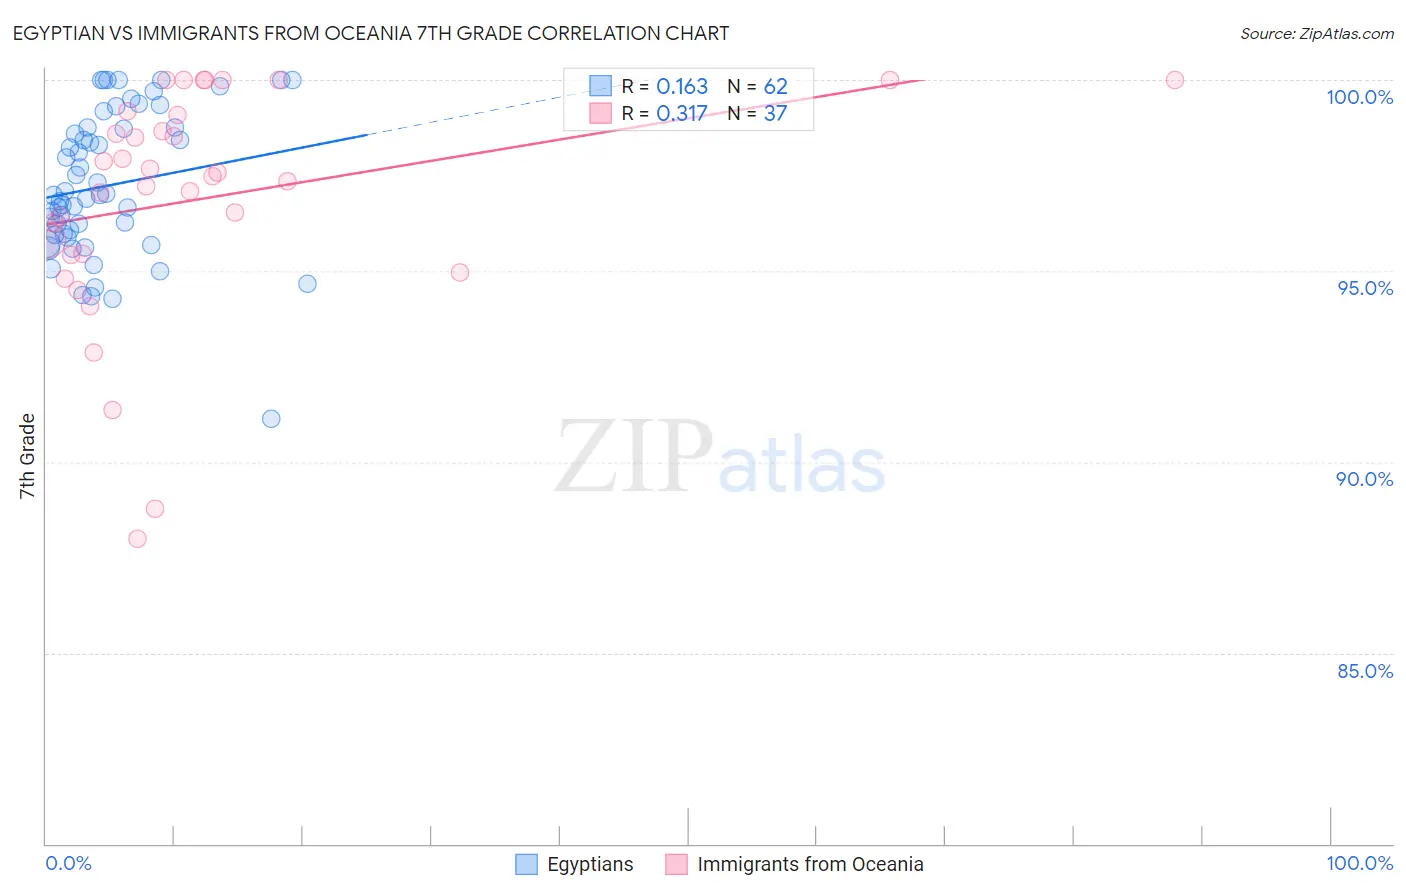
Egyptian vs Immigrants from Oceania 7th Grade Correlation Chart
The statistical analysis conducted on geographies consisting of 276,927,423 people shows a poor positive correlation between the proportion of Egyptians and percentage of population with at least 7th grade education in the United States with a correlation coefficient (R) of 0.163 and weighted average of 96.1%. Similarly, the statistical analysis conducted on geographies consisting of 305,521,521 people shows a mild positive correlation between the proportion of Immigrants from Oceania and percentage of population with at least 7th grade education in the United States with a correlation coefficient (R) of 0.317 and weighted average of 95.7%, a difference of 0.43%.
7th Grade Correlation Summary
| Measurement | Egyptian | Immigrants from Oceania |
| Minimum | 91.1% | 88.0% |
| Maximum | 100.0% | 100.0% |
| Range | 8.9% | 12.0% |
| Mean | 97.2% | 96.9% |
| Median | 97.0% | 97.5% |
| Interquartile 25% (IQ1) | 95.9% | 95.4% |
| Interquartile 75% (IQ3) | 98.8% | 99.1% |
| Interquartile Range (IQR) | 2.8% | 3.7% |
| Standard Deviation (Sample) | 1.9% | 3.0% |
| Standard Deviation (Population) | 1.9% | 3.0% |
Similar Demographics by 7th Grade
Demographics Similar to Egyptians by 7th Grade
In terms of 7th grade, the demographic groups most similar to Egyptians are Immigrants from Ukraine (96.1%, a difference of 0.0%), Ute (96.1%, a difference of 0.010%), Venezuelan (96.0%, a difference of 0.020%), Immigrants from Albania (96.0%, a difference of 0.020%), and Immigrants from Poland (96.1%, a difference of 0.030%).
| Demographics | Rating | Rank | 7th Grade |
| Immigrants | Italy | 62.1 /100 | #164 | Good 96.1% |
| Immigrants | Taiwan | 61.5 /100 | #165 | Good 96.1% |
| Immigrants | Kazakhstan | 61.0 /100 | #166 | Good 96.1% |
| Immigrants | Sri Lanka | 59.9 /100 | #167 | Average 96.1% |
| Immigrants | Poland | 59.0 /100 | #168 | Average 96.1% |
| Ute | 55.8 /100 | #169 | Average 96.1% |
| Immigrants | Ukraine | 55.0 /100 | #170 | Average 96.1% |
| Egyptians | 54.2 /100 | #171 | Average 96.1% |
| Venezuelans | 51.4 /100 | #172 | Average 96.0% |
| Immigrants | Albania | 50.4 /100 | #173 | Average 96.0% |
| Mongolians | 50.0 /100 | #174 | Average 96.0% |
| Blacks/African Americans | 49.5 /100 | #175 | Average 96.0% |
| Chileans | 49.3 /100 | #176 | Average 96.0% |
| Immigrants | Korea | 49.2 /100 | #177 | Average 96.0% |
| Marshallese | 48.4 /100 | #178 | Average 96.0% |
Demographics Similar to Immigrants from Oceania by 7th Grade
In terms of 7th grade, the demographic groups most similar to Immigrants from Oceania are Laotian (95.7%, a difference of 0.0%), Immigrants from Syria (95.7%, a difference of 0.0%), Subsaharan African (95.7%, a difference of 0.010%), Samoan (95.7%, a difference of 0.010%), and Immigrants from Malaysia (95.6%, a difference of 0.010%).
| Demographics | Rating | Rank | 7th Grade |
| Immigrants | Pakistan | 9.0 /100 | #217 | Tragic 95.7% |
| Immigrants | Liberia | 8.1 /100 | #218 | Tragic 95.7% |
| Immigrants | Southern Europe | 7.9 /100 | #219 | Tragic 95.7% |
| Sub-Saharan Africans | 7.2 /100 | #220 | Tragic 95.7% |
| Samoans | 7.0 /100 | #221 | Tragic 95.7% |
| Laotians | 6.8 /100 | #222 | Tragic 95.7% |
| Immigrants | Syria | 6.7 /100 | #223 | Tragic 95.7% |
| Immigrants | Oceania | 6.7 /100 | #224 | Tragic 95.7% |
| Immigrants | Malaysia | 6.2 /100 | #225 | Tragic 95.6% |
| Immigrants | Eastern Asia | 5.8 /100 | #226 | Tragic 95.6% |
| Immigrants | Western Asia | 5.4 /100 | #227 | Tragic 95.6% |
| Immigrants | Eastern Africa | 5.1 /100 | #228 | Tragic 95.6% |
| Immigrants | Panama | 4.9 /100 | #229 | Tragic 95.6% |
| Natives/Alaskans | 4.2 /100 | #230 | Tragic 95.6% |
| Senegalese | 4.0 /100 | #231 | Tragic 95.6% |