English vs Immigrants from Oceania 7th Grade
COMPARE
English
Immigrants from Oceania
7th Grade
7th Grade Comparison
English
Immigrants from Oceania
97.6%
7TH GRADE
100.0/ 100
METRIC RATING
15th/ 347
METRIC RANK
95.7%
7TH GRADE
6.7/ 100
METRIC RATING
224th/ 347
METRIC RANK
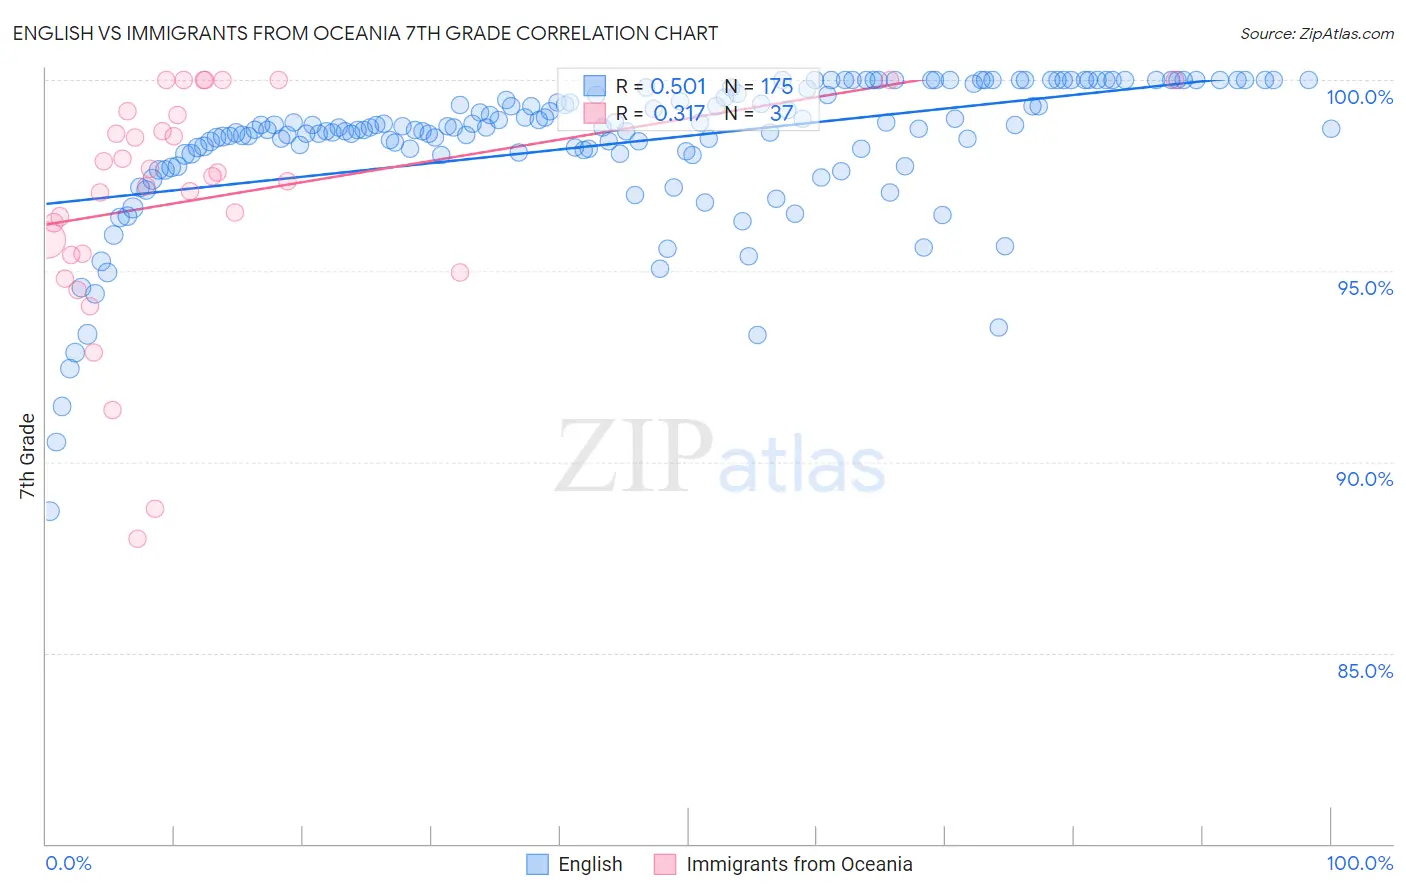
English vs Immigrants from Oceania 7th Grade Correlation Chart
The statistical analysis conducted on geographies consisting of 579,981,272 people shows a substantial positive correlation between the proportion of English and percentage of population with at least 7th grade education in the United States with a correlation coefficient (R) of 0.501 and weighted average of 97.6%. Similarly, the statistical analysis conducted on geographies consisting of 305,521,521 people shows a mild positive correlation between the proportion of Immigrants from Oceania and percentage of population with at least 7th grade education in the United States with a correlation coefficient (R) of 0.317 and weighted average of 95.7%, a difference of 2.0%.
7th Grade Correlation Summary
| Measurement | English | Immigrants from Oceania |
| Minimum | 88.7% | 88.0% |
| Maximum | 100.0% | 100.0% |
| Range | 11.3% | 12.0% |
| Mean | 98.3% | 96.9% |
| Median | 98.7% | 97.5% |
| Interquartile 25% (IQ1) | 98.1% | 95.4% |
| Interquartile 75% (IQ3) | 99.6% | 99.1% |
| Interquartile Range (IQR) | 1.5% | 3.7% |
| Standard Deviation (Sample) | 1.9% | 3.0% |
| Standard Deviation (Population) | 1.9% | 3.0% |
Similar Demographics by 7th Grade
Demographics Similar to English by 7th Grade
In terms of 7th grade, the demographic groups most similar to English are Pennsylvania German (97.6%, a difference of 0.010%), Swedish (97.6%, a difference of 0.020%), Alaskan Athabascan (97.6%, a difference of 0.060%), Polish (97.6%, a difference of 0.060%), and Irish (97.5%, a difference of 0.060%).
| Demographics | Rating | Rank | 7th Grade |
| Slovaks | 100.0 /100 | #8 | Exceptional 97.8% |
| Germans | 100.0 /100 | #9 | Exceptional 97.7% |
| Slovenes | 100.0 /100 | #10 | Exceptional 97.6% |
| Alaskan Athabascans | 100.0 /100 | #11 | Exceptional 97.6% |
| Poles | 100.0 /100 | #12 | Exceptional 97.6% |
| Swedes | 100.0 /100 | #13 | Exceptional 97.6% |
| Pennsylvania Germans | 100.0 /100 | #14 | Exceptional 97.6% |
| English | 100.0 /100 | #15 | Exceptional 97.6% |
| Irish | 100.0 /100 | #16 | Exceptional 97.5% |
| Scottish | 100.0 /100 | #17 | Exceptional 97.5% |
| Tlingit-Haida | 100.0 /100 | #18 | Exceptional 97.5% |
| Lithuanians | 100.0 /100 | #19 | Exceptional 97.5% |
| Yup'ik | 100.0 /100 | #20 | Exceptional 97.4% |
| Inupiat | 100.0 /100 | #21 | Exceptional 97.4% |
| French Canadians | 100.0 /100 | #22 | Exceptional 97.4% |
Demographics Similar to Immigrants from Oceania by 7th Grade
In terms of 7th grade, the demographic groups most similar to Immigrants from Oceania are Laotian (95.7%, a difference of 0.0%), Immigrants from Syria (95.7%, a difference of 0.0%), Subsaharan African (95.7%, a difference of 0.010%), Samoan (95.7%, a difference of 0.010%), and Immigrants from Malaysia (95.6%, a difference of 0.010%).
| Demographics | Rating | Rank | 7th Grade |
| Immigrants | Pakistan | 9.0 /100 | #217 | Tragic 95.7% |
| Immigrants | Liberia | 8.1 /100 | #218 | Tragic 95.7% |
| Immigrants | Southern Europe | 7.9 /100 | #219 | Tragic 95.7% |
| Sub-Saharan Africans | 7.2 /100 | #220 | Tragic 95.7% |
| Samoans | 7.0 /100 | #221 | Tragic 95.7% |
| Laotians | 6.8 /100 | #222 | Tragic 95.7% |
| Immigrants | Syria | 6.7 /100 | #223 | Tragic 95.7% |
| Immigrants | Oceania | 6.7 /100 | #224 | Tragic 95.7% |
| Immigrants | Malaysia | 6.2 /100 | #225 | Tragic 95.6% |
| Immigrants | Eastern Asia | 5.8 /100 | #226 | Tragic 95.6% |
| Immigrants | Western Asia | 5.4 /100 | #227 | Tragic 95.6% |
| Immigrants | Eastern Africa | 5.1 /100 | #228 | Tragic 95.6% |
| Immigrants | Panama | 4.9 /100 | #229 | Tragic 95.6% |
| Natives/Alaskans | 4.2 /100 | #230 | Tragic 95.6% |
| Senegalese | 4.0 /100 | #231 | Tragic 95.6% |