Spanish American vs Greek 1st Grade
COMPARE
Spanish American
Greek
1st Grade
1st Grade Comparison
Spanish Americans
Greeks
97.9%
1ST GRADE
57.7/ 100
METRIC RATING
163rd/ 347
METRIC RANK
98.4%
1ST GRADE
99.7/ 100
METRIC RATING
64th/ 347
METRIC RANK
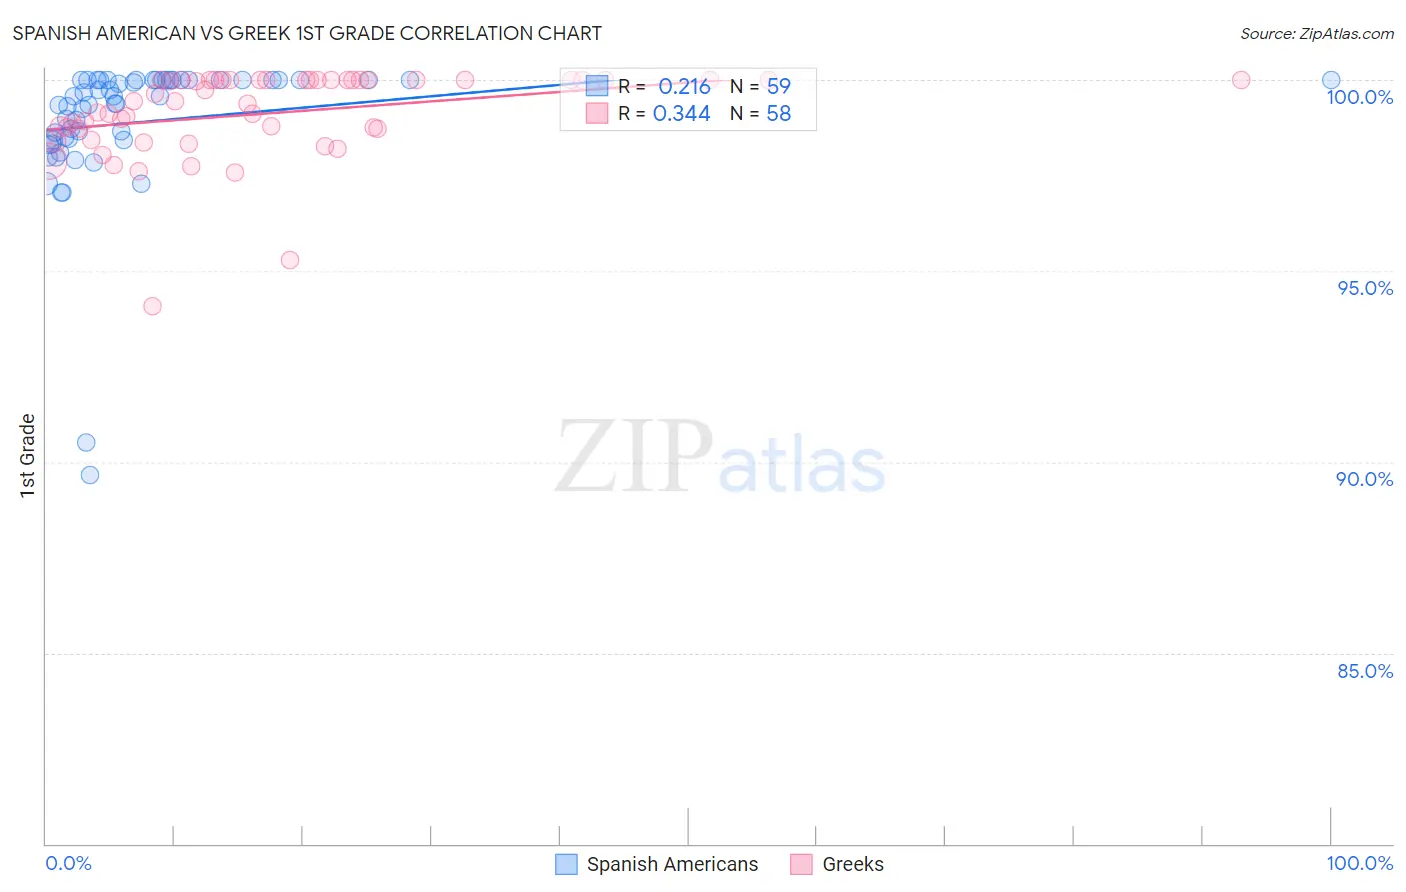
Spanish American vs Greek 1st Grade Correlation Chart
The statistical analysis conducted on geographies consisting of 103,168,542 people shows a weak positive correlation between the proportion of Spanish Americans and percentage of population with at least 1st grade education in the United States with a correlation coefficient (R) of 0.216 and weighted average of 97.9%. Similarly, the statistical analysis conducted on geographies consisting of 482,775,358 people shows a mild positive correlation between the proportion of Greeks and percentage of population with at least 1st grade education in the United States with a correlation coefficient (R) of 0.344 and weighted average of 98.4%, a difference of 0.43%.
1st Grade Correlation Summary
| Measurement | Spanish American | Greek |
| Minimum | 89.6% | 94.1% |
| Maximum | 100.0% | 100.0% |
| Range | 10.4% | 5.9% |
| Mean | 98.9% | 99.1% |
| Median | 99.6% | 99.4% |
| Interquartile 25% (IQ1) | 98.4% | 98.7% |
| Interquartile 75% (IQ3) | 100.0% | 100.0% |
| Interquartile Range (IQR) | 1.6% | 1.3% |
| Standard Deviation (Sample) | 1.9% | 1.2% |
| Standard Deviation (Population) | 1.9% | 1.1% |
Similar Demographics by 1st Grade
Demographics Similar to Spanish Americans by 1st Grade
In terms of 1st grade, the demographic groups most similar to Spanish Americans are Immigrants from Russia (97.9%, a difference of 0.0%), Immigrants from Italy (97.9%, a difference of 0.0%), Immigrants from Eastern Europe (97.9%, a difference of 0.0%), Brazilian (97.9%, a difference of 0.0%), and Ugandan (97.9%, a difference of 0.0%).
| Demographics | Rating | Rank | 1st Grade |
| Immigrants | South Central Asia | 66.2 /100 | #156 | Good 98.0% |
| Immigrants | North Macedonia | 65.3 /100 | #157 | Good 98.0% |
| Venezuelans | 64.7 /100 | #158 | Good 98.0% |
| French American Indians | 63.7 /100 | #159 | Good 98.0% |
| Immigrants | Russia | 59.2 /100 | #160 | Average 97.9% |
| Immigrants | Italy | 59.1 /100 | #161 | Average 97.9% |
| Immigrants | Eastern Europe | 58.9 /100 | #162 | Average 97.9% |
| Spanish Americans | 57.7 /100 | #163 | Average 97.9% |
| Brazilians | 57.6 /100 | #164 | Average 97.9% |
| Ugandans | 56.9 /100 | #165 | Average 97.9% |
| Navajo | 56.6 /100 | #166 | Average 97.9% |
| Bermudans | 56.3 /100 | #167 | Average 97.9% |
| Chileans | 55.6 /100 | #168 | Average 97.9% |
| Immigrants | Micronesia | 55.3 /100 | #169 | Average 97.9% |
| Immigrants | Spain | 54.9 /100 | #170 | Average 97.9% |
Demographics Similar to Greeks by 1st Grade
In terms of 1st grade, the demographic groups most similar to Greeks are Bulgarian (98.4%, a difference of 0.0%), Slavic (98.4%, a difference of 0.0%), Immigrants from North America (98.4%, a difference of 0.0%), Austrian (98.4%, a difference of 0.010%), and New Zealander (98.4%, a difference of 0.010%).
| Demographics | Rating | Rank | 1st Grade |
| Austrians | 99.8 /100 | #57 | Exceptional 98.4% |
| New Zealanders | 99.7 /100 | #58 | Exceptional 98.4% |
| Creek | 99.7 /100 | #59 | Exceptional 98.4% |
| Immigrants | Canada | 99.7 /100 | #60 | Exceptional 98.4% |
| Bulgarians | 99.7 /100 | #61 | Exceptional 98.4% |
| Slavs | 99.7 /100 | #62 | Exceptional 98.4% |
| Immigrants | North America | 99.7 /100 | #63 | Exceptional 98.4% |
| Greeks | 99.7 /100 | #64 | Exceptional 98.4% |
| Maltese | 99.7 /100 | #65 | Exceptional 98.4% |
| Canadians | 99.6 /100 | #66 | Exceptional 98.3% |
| Immigrants | Austria | 99.6 /100 | #67 | Exceptional 98.3% |
| Immigrants | Northern Europe | 99.6 /100 | #68 | Exceptional 98.3% |
| Chickasaw | 99.6 /100 | #69 | Exceptional 98.3% |
| Russians | 99.6 /100 | #70 | Exceptional 98.3% |
| Serbians | 99.6 /100 | #71 | Exceptional 98.3% |