Spanish American vs Immigrants from Spain 1st Grade
COMPARE
Spanish American
Immigrants from Spain
1st Grade
1st Grade Comparison
Spanish Americans
Immigrants from Spain
97.9%
1ST GRADE
57.7/ 100
METRIC RATING
163rd/ 347
METRIC RANK
97.9%
1ST GRADE
54.9/ 100
METRIC RATING
170th/ 347
METRIC RANK
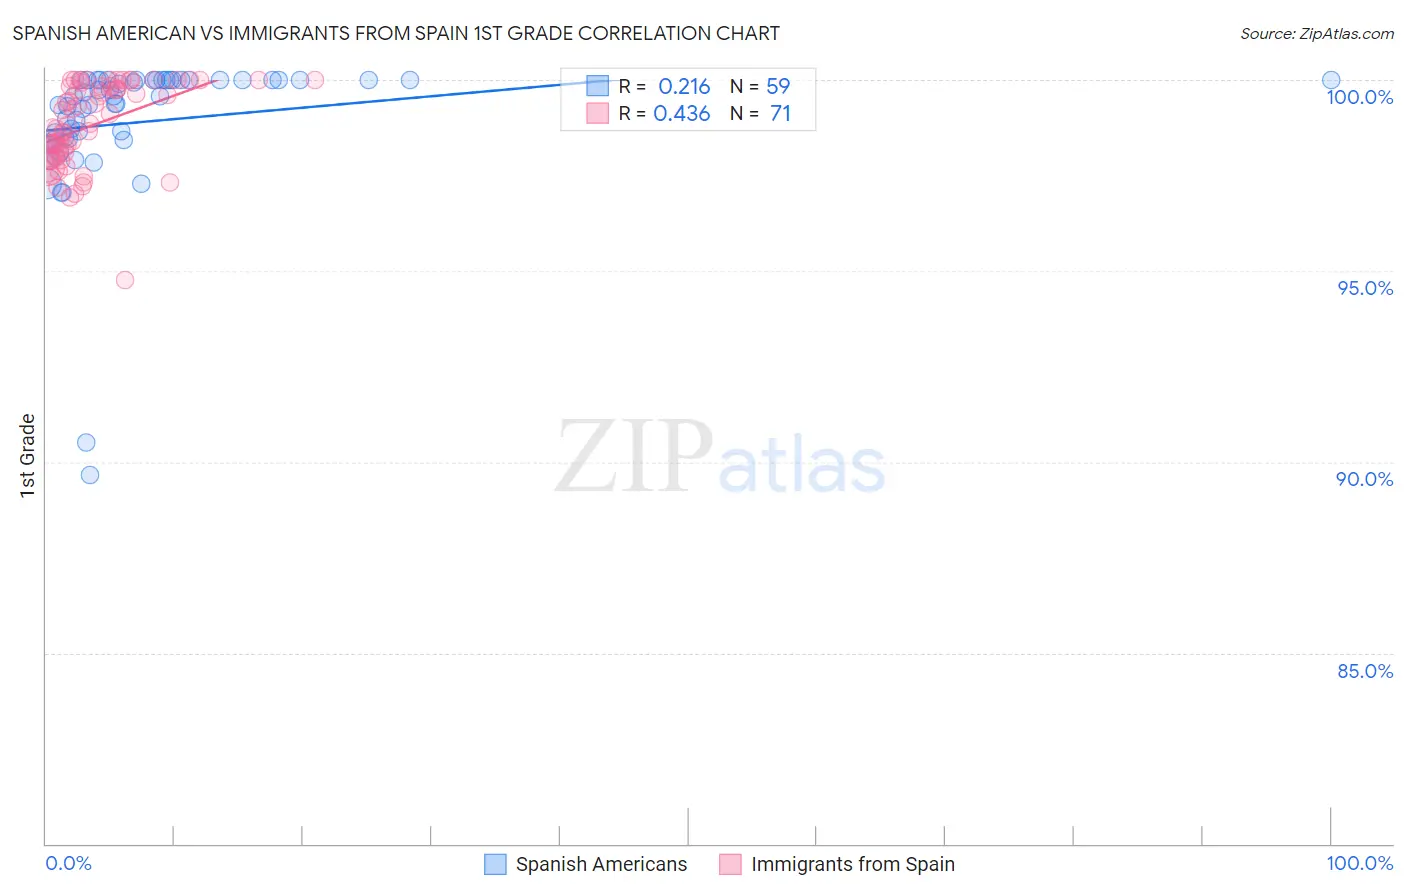
Spanish American vs Immigrants from Spain 1st Grade Correlation Chart
The statistical analysis conducted on geographies consisting of 103,168,542 people shows a weak positive correlation between the proportion of Spanish Americans and percentage of population with at least 1st grade education in the United States with a correlation coefficient (R) of 0.216 and weighted average of 97.9%. Similarly, the statistical analysis conducted on geographies consisting of 239,682,160 people shows a moderate positive correlation between the proportion of Immigrants from Spain and percentage of population with at least 1st grade education in the United States with a correlation coefficient (R) of 0.436 and weighted average of 97.9%, a difference of 0.010%.
1st Grade Correlation Summary
| Measurement | Spanish American | Immigrants from Spain |
| Minimum | 89.6% | 94.8% |
| Maximum | 100.0% | 100.0% |
| Range | 10.4% | 5.2% |
| Mean | 98.9% | 98.8% |
| Median | 99.6% | 98.8% |
| Interquartile 25% (IQ1) | 98.4% | 98.0% |
| Interquartile 75% (IQ3) | 100.0% | 99.8% |
| Interquartile Range (IQR) | 1.6% | 1.9% |
| Standard Deviation (Sample) | 1.9% | 1.1% |
| Standard Deviation (Population) | 1.9% | 1.1% |
Demographics Similar to Spanish Americans and Immigrants from Spain by 1st Grade
In terms of 1st grade, the demographic groups most similar to Spanish Americans are Immigrants from Russia (97.9%, a difference of 0.0%), Immigrants from Italy (97.9%, a difference of 0.0%), Immigrants from Eastern Europe (97.9%, a difference of 0.0%), Brazilian (97.9%, a difference of 0.0%), and Ugandan (97.9%, a difference of 0.0%). Similarly, the demographic groups most similar to Immigrants from Spain are Bermudan (97.9%, a difference of 0.0%), Chilean (97.9%, a difference of 0.0%), Immigrants from Micronesia (97.9%, a difference of 0.0%), Immigrants from Jordan (97.9%, a difference of 0.0%), and Immigrants from Russia (97.9%, a difference of 0.010%).
| Demographics | Rating | Rank | 1st Grade |
| Immigrants | South Central Asia | 66.2 /100 | #156 | Good 98.0% |
| Immigrants | North Macedonia | 65.3 /100 | #157 | Good 98.0% |
| Venezuelans | 64.7 /100 | #158 | Good 98.0% |
| French American Indians | 63.7 /100 | #159 | Good 98.0% |
| Immigrants | Russia | 59.2 /100 | #160 | Average 97.9% |
| Immigrants | Italy | 59.1 /100 | #161 | Average 97.9% |
| Immigrants | Eastern Europe | 58.9 /100 | #162 | Average 97.9% |
| Spanish Americans | 57.7 /100 | #163 | Average 97.9% |
| Brazilians | 57.6 /100 | #164 | Average 97.9% |
| Ugandans | 56.9 /100 | #165 | Average 97.9% |
| Navajo | 56.6 /100 | #166 | Average 97.9% |
| Bermudans | 56.3 /100 | #167 | Average 97.9% |
| Chileans | 55.6 /100 | #168 | Average 97.9% |
| Immigrants | Micronesia | 55.3 /100 | #169 | Average 97.9% |
| Immigrants | Spain | 54.9 /100 | #170 | Average 97.9% |
| Immigrants | Jordan | 53.9 /100 | #171 | Average 97.9% |
| Immigrants | Korea | 53.0 /100 | #172 | Average 97.9% |
| Kenyans | 51.2 /100 | #173 | Average 97.9% |
| Natives/Alaskans | 50.0 /100 | #174 | Average 97.9% |
| Immigrants | Sri Lanka | 49.7 /100 | #175 | Average 97.9% |
| Albanians | 49.6 /100 | #176 | Average 97.9% |