Spanish American vs Blackfeet 1st Grade
COMPARE
Spanish American
Blackfeet
1st Grade
1st Grade Comparison
Spanish Americans
Blackfeet
97.9%
1ST GRADE
57.7/ 100
METRIC RATING
163rd/ 347
METRIC RANK
98.1%
1ST GRADE
87.6/ 100
METRIC RATING
139th/ 347
METRIC RANK
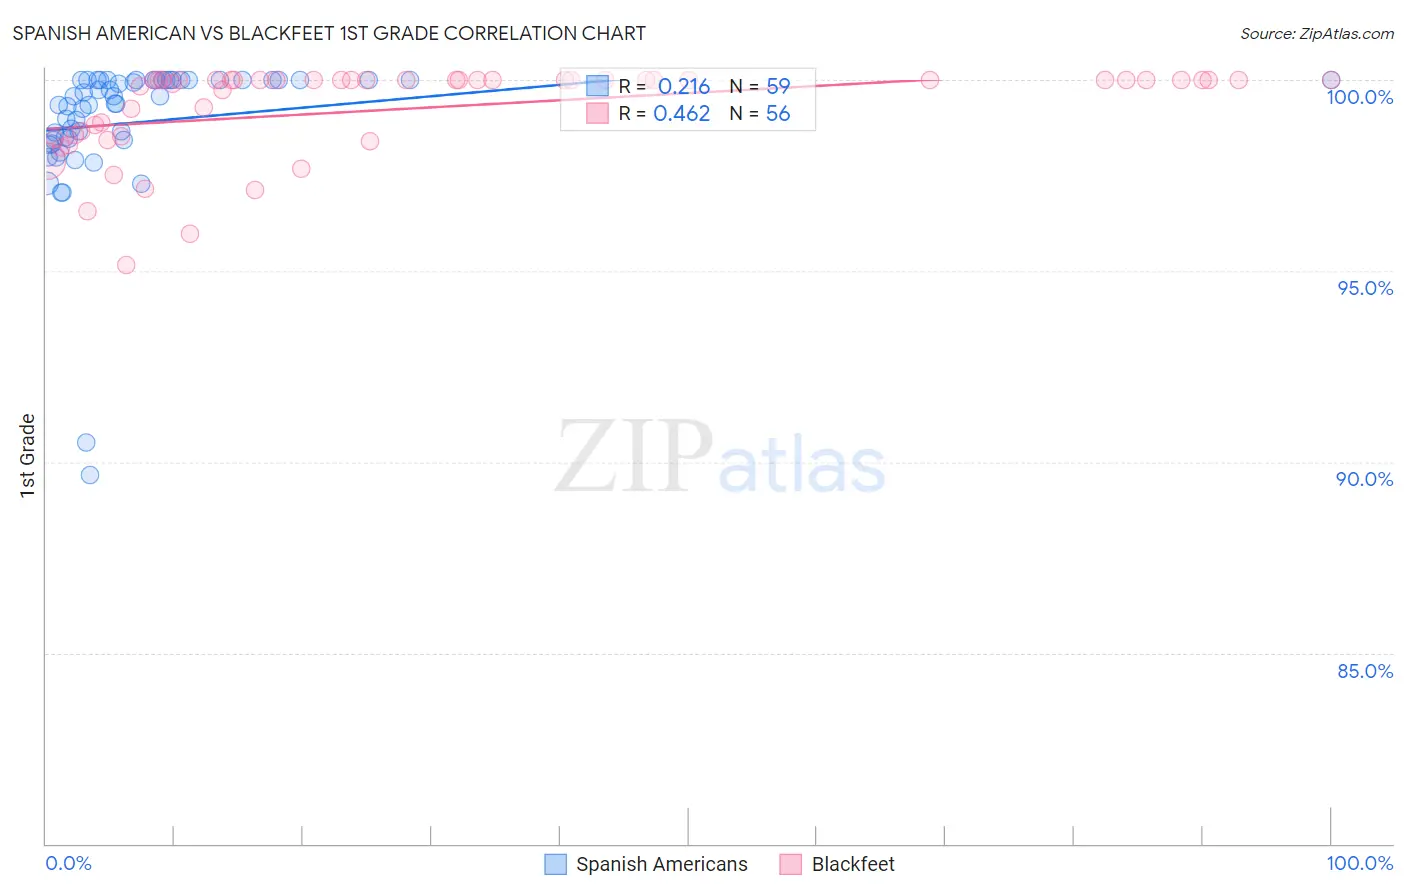
Spanish American vs Blackfeet 1st Grade Correlation Chart
The statistical analysis conducted on geographies consisting of 103,168,542 people shows a weak positive correlation between the proportion of Spanish Americans and percentage of population with at least 1st grade education in the United States with a correlation coefficient (R) of 0.216 and weighted average of 97.9%. Similarly, the statistical analysis conducted on geographies consisting of 309,580,957 people shows a moderate positive correlation between the proportion of Blackfeet and percentage of population with at least 1st grade education in the United States with a correlation coefficient (R) of 0.462 and weighted average of 98.1%, a difference of 0.13%.
1st Grade Correlation Summary
| Measurement | Spanish American | Blackfeet |
| Minimum | 89.6% | 95.2% |
| Maximum | 100.0% | 100.0% |
| Range | 10.4% | 4.8% |
| Mean | 98.9% | 99.3% |
| Median | 99.6% | 100.0% |
| Interquartile 25% (IQ1) | 98.4% | 98.5% |
| Interquartile 75% (IQ3) | 100.0% | 100.0% |
| Interquartile Range (IQR) | 1.6% | 1.5% |
| Standard Deviation (Sample) | 1.9% | 1.2% |
| Standard Deviation (Population) | 1.9% | 1.2% |
Similar Demographics by 1st Grade
Demographics Similar to Spanish Americans by 1st Grade
In terms of 1st grade, the demographic groups most similar to Spanish Americans are Immigrants from Russia (97.9%, a difference of 0.0%), Immigrants from Italy (97.9%, a difference of 0.0%), Immigrants from Eastern Europe (97.9%, a difference of 0.0%), Brazilian (97.9%, a difference of 0.0%), and Ugandan (97.9%, a difference of 0.0%).
| Demographics | Rating | Rank | 1st Grade |
| Immigrants | South Central Asia | 66.2 /100 | #156 | Good 98.0% |
| Immigrants | North Macedonia | 65.3 /100 | #157 | Good 98.0% |
| Venezuelans | 64.7 /100 | #158 | Good 98.0% |
| French American Indians | 63.7 /100 | #159 | Good 98.0% |
| Immigrants | Russia | 59.2 /100 | #160 | Average 97.9% |
| Immigrants | Italy | 59.1 /100 | #161 | Average 97.9% |
| Immigrants | Eastern Europe | 58.9 /100 | #162 | Average 97.9% |
| Spanish Americans | 57.7 /100 | #163 | Average 97.9% |
| Brazilians | 57.6 /100 | #164 | Average 97.9% |
| Ugandans | 56.9 /100 | #165 | Average 97.9% |
| Navajo | 56.6 /100 | #166 | Average 97.9% |
| Bermudans | 56.3 /100 | #167 | Average 97.9% |
| Chileans | 55.6 /100 | #168 | Average 97.9% |
| Immigrants | Micronesia | 55.3 /100 | #169 | Average 97.9% |
| Immigrants | Spain | 54.9 /100 | #170 | Average 97.9% |
Demographics Similar to Blackfeet by 1st Grade
In terms of 1st grade, the demographic groups most similar to Blackfeet are Israeli (98.1%, a difference of 0.0%), Immigrants from Romania (98.1%, a difference of 0.0%), Immigrants from Hungary (98.1%, a difference of 0.010%), Immigrants from Kuwait (98.1%, a difference of 0.010%), and Immigrants from Bulgaria (98.1%, a difference of 0.010%).
| Demographics | Rating | Rank | 1st Grade |
| Cambodians | 90.9 /100 | #132 | Exceptional 98.1% |
| Immigrants | Europe | 90.5 /100 | #133 | Exceptional 98.1% |
| Immigrants | Hungary | 89.4 /100 | #134 | Excellent 98.1% |
| Immigrants | Kuwait | 89.3 /100 | #135 | Excellent 98.1% |
| Immigrants | Bulgaria | 88.8 /100 | #136 | Excellent 98.1% |
| Israelis | 87.8 /100 | #137 | Excellent 98.1% |
| Immigrants | Romania | 87.8 /100 | #138 | Excellent 98.1% |
| Blackfeet | 87.6 /100 | #139 | Excellent 98.1% |
| Palestinians | 83.0 /100 | #140 | Excellent 98.0% |
| Immigrants | Turkey | 82.8 /100 | #141 | Excellent 98.0% |
| Marshallese | 82.0 /100 | #142 | Excellent 98.0% |
| Burmese | 81.0 /100 | #143 | Excellent 98.0% |
| Alsatians | 80.9 /100 | #144 | Excellent 98.0% |
| Hmong | 79.0 /100 | #145 | Good 98.0% |
| Immigrants | Israel | 77.8 /100 | #146 | Good 98.0% |