Slovak vs Greek 1st Grade
COMPARE
Slovak
Greek
1st Grade
1st Grade Comparison
Slovaks
Greeks
98.7%
1ST GRADE
100.0/ 100
METRIC RATING
9th/ 347
METRIC RANK
98.4%
1ST GRADE
99.7/ 100
METRIC RATING
64th/ 347
METRIC RANK
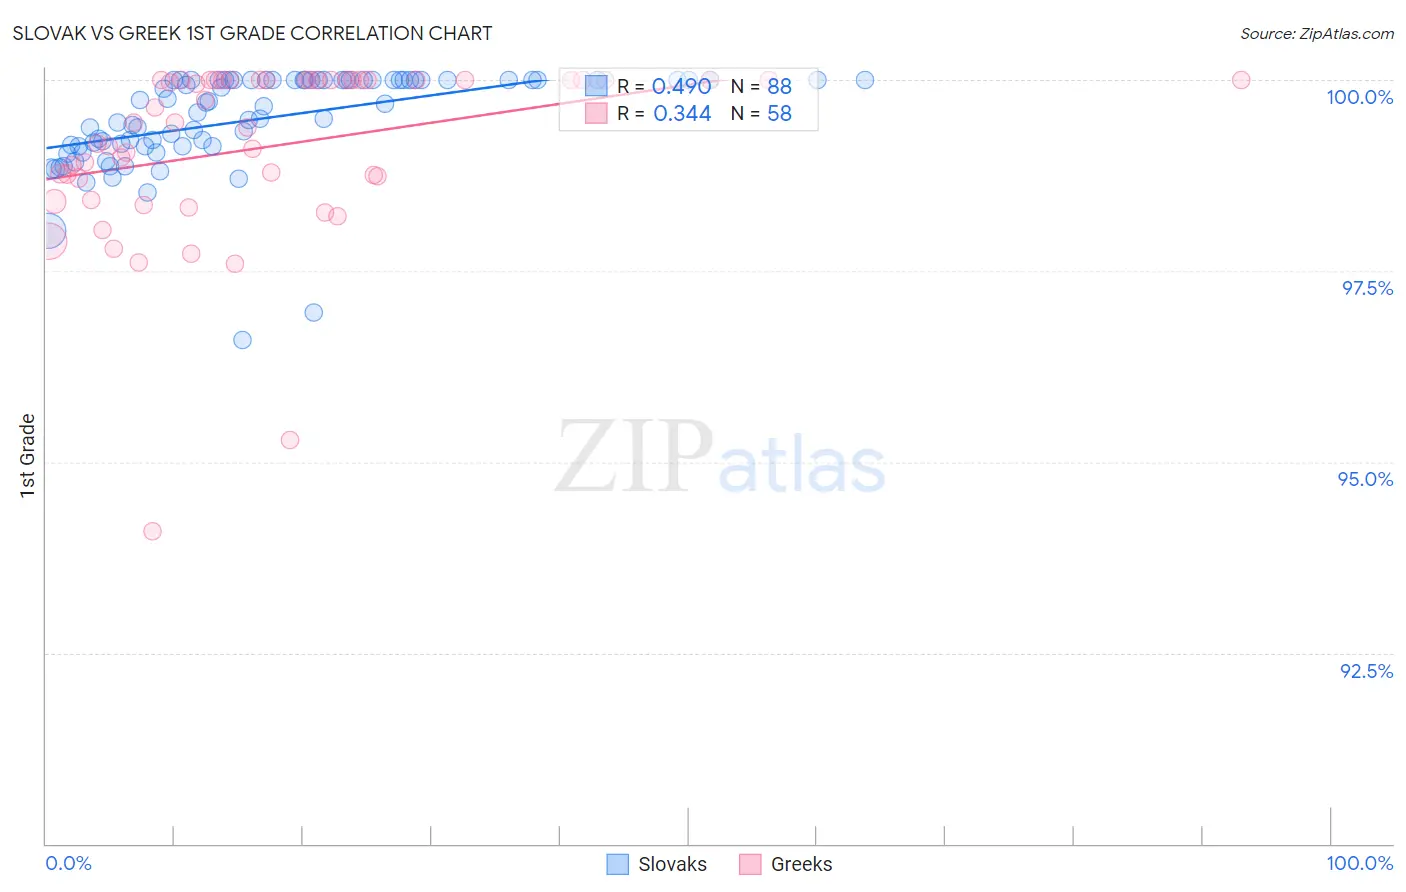
Slovak vs Greek 1st Grade Correlation Chart
The statistical analysis conducted on geographies consisting of 397,890,986 people shows a moderate positive correlation between the proportion of Slovaks and percentage of population with at least 1st grade education in the United States with a correlation coefficient (R) of 0.490 and weighted average of 98.7%. Similarly, the statistical analysis conducted on geographies consisting of 482,775,358 people shows a mild positive correlation between the proportion of Greeks and percentage of population with at least 1st grade education in the United States with a correlation coefficient (R) of 0.344 and weighted average of 98.4%, a difference of 0.32%.
1st Grade Correlation Summary
| Measurement | Slovak | Greek |
| Minimum | 96.6% | 94.1% |
| Maximum | 100.0% | 100.0% |
| Range | 3.4% | 5.9% |
| Mean | 99.5% | 99.1% |
| Median | 99.7% | 99.4% |
| Interquartile 25% (IQ1) | 99.1% | 98.7% |
| Interquartile 75% (IQ3) | 100.0% | 100.0% |
| Interquartile Range (IQR) | 0.86% | 1.3% |
| Standard Deviation (Sample) | 0.64% | 1.2% |
| Standard Deviation (Population) | 0.64% | 1.1% |
Similar Demographics by 1st Grade
Demographics Similar to Slovaks by 1st Grade
In terms of 1st grade, the demographic groups most similar to Slovaks are German (98.7%, a difference of 0.0%), Norwegian (98.7%, a difference of 0.020%), Tlingit-Haida (98.7%, a difference of 0.020%), Slovene (98.7%, a difference of 0.030%), and Alaska Native (98.7%, a difference of 0.040%).
| Demographics | Rating | Rank | 1st Grade |
| Yup'ik | 100.0 /100 | #2 | Exceptional 99.2% |
| Inupiat | 100.0 /100 | #3 | Exceptional 98.9% |
| Welsh | 100.0 /100 | #4 | Exceptional 98.9% |
| Tsimshian | 100.0 /100 | #5 | Exceptional 98.8% |
| Alaskan Athabascans | 100.0 /100 | #6 | Exceptional 98.8% |
| Alaska Natives | 100.0 /100 | #7 | Exceptional 98.7% |
| Norwegians | 100.0 /100 | #8 | Exceptional 98.7% |
| Slovaks | 100.0 /100 | #9 | Exceptional 98.7% |
| Germans | 100.0 /100 | #10 | Exceptional 98.7% |
| Tlingit-Haida | 100.0 /100 | #11 | Exceptional 98.7% |
| Slovenes | 100.0 /100 | #12 | Exceptional 98.7% |
| Carpatho Rusyns | 100.0 /100 | #13 | Exceptional 98.6% |
| English | 100.0 /100 | #14 | Exceptional 98.6% |
| Swedes | 100.0 /100 | #15 | Exceptional 98.6% |
| Aleuts | 100.0 /100 | #16 | Exceptional 98.6% |
Demographics Similar to Greeks by 1st Grade
In terms of 1st grade, the demographic groups most similar to Greeks are Bulgarian (98.4%, a difference of 0.0%), Slavic (98.4%, a difference of 0.0%), Immigrants from North America (98.4%, a difference of 0.0%), Austrian (98.4%, a difference of 0.010%), and New Zealander (98.4%, a difference of 0.010%).
| Demographics | Rating | Rank | 1st Grade |
| Austrians | 99.8 /100 | #57 | Exceptional 98.4% |
| New Zealanders | 99.7 /100 | #58 | Exceptional 98.4% |
| Creek | 99.7 /100 | #59 | Exceptional 98.4% |
| Immigrants | Canada | 99.7 /100 | #60 | Exceptional 98.4% |
| Bulgarians | 99.7 /100 | #61 | Exceptional 98.4% |
| Slavs | 99.7 /100 | #62 | Exceptional 98.4% |
| Immigrants | North America | 99.7 /100 | #63 | Exceptional 98.4% |
| Greeks | 99.7 /100 | #64 | Exceptional 98.4% |
| Maltese | 99.7 /100 | #65 | Exceptional 98.4% |
| Canadians | 99.6 /100 | #66 | Exceptional 98.3% |
| Immigrants | Austria | 99.6 /100 | #67 | Exceptional 98.3% |
| Immigrants | Northern Europe | 99.6 /100 | #68 | Exceptional 98.3% |
| Chickasaw | 99.6 /100 | #69 | Exceptional 98.3% |
| Russians | 99.6 /100 | #70 | Exceptional 98.3% |
| Serbians | 99.6 /100 | #71 | Exceptional 98.3% |