Spanish American vs Finnish 2nd Grade
COMPARE
Spanish American
Finnish
2nd Grade
2nd Grade Comparison
Spanish Americans
Finns
97.9%
2ND GRADE
56.4/ 100
METRIC RATING
165th/ 347
METRIC RANK
98.5%
2ND GRADE
100.0/ 100
METRIC RATING
19th/ 347
METRIC RANK
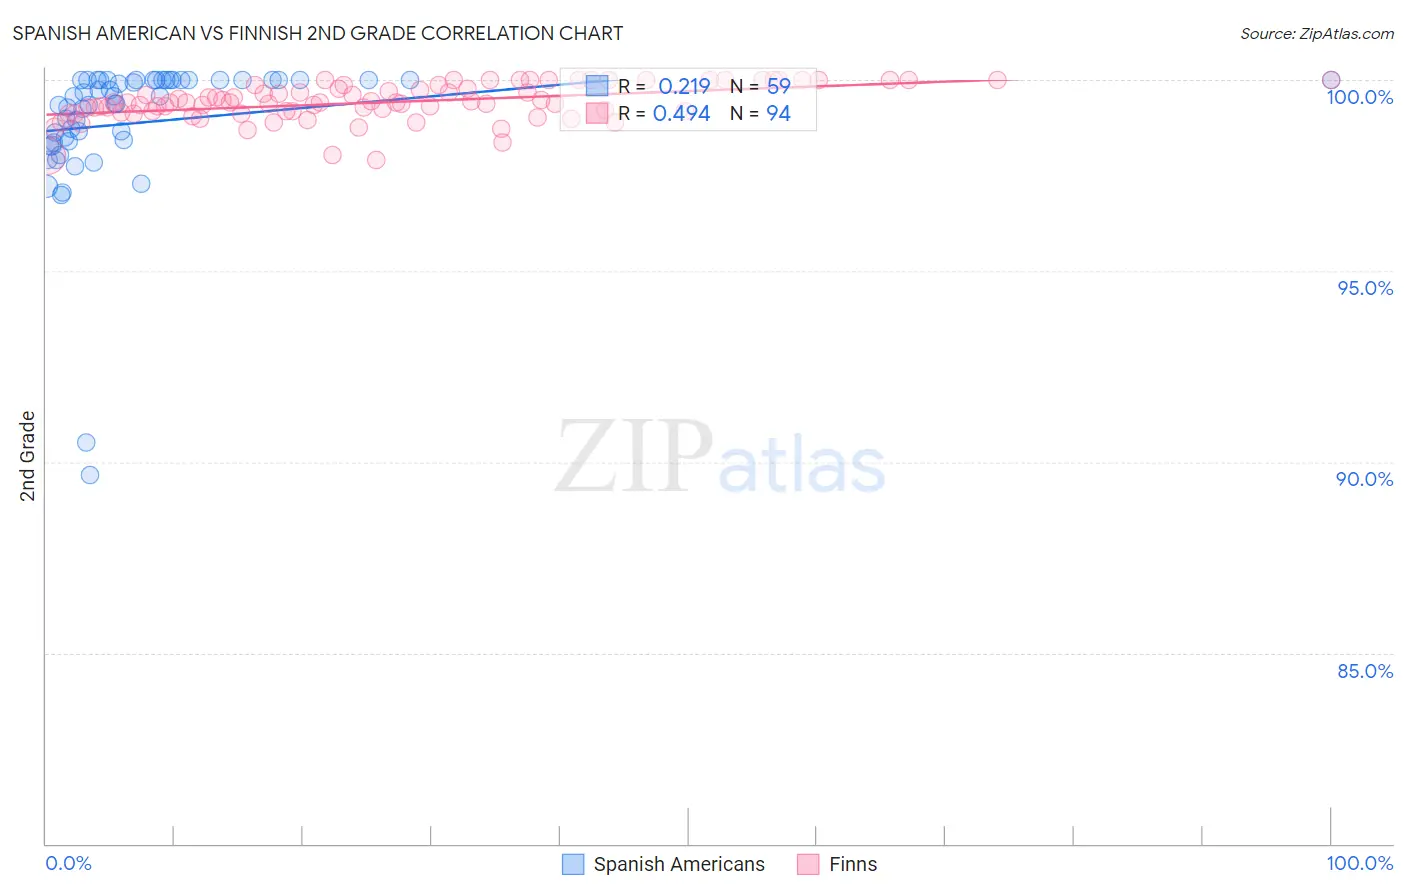
Spanish American vs Finnish 2nd Grade Correlation Chart
The statistical analysis conducted on geographies consisting of 103,168,542 people shows a weak positive correlation between the proportion of Spanish Americans and percentage of population with at least 2nd grade education in the United States with a correlation coefficient (R) of 0.219 and weighted average of 97.9%. Similarly, the statistical analysis conducted on geographies consisting of 404,675,516 people shows a moderate positive correlation between the proportion of Finns and percentage of population with at least 2nd grade education in the United States with a correlation coefficient (R) of 0.494 and weighted average of 98.5%, a difference of 0.68%.
2nd Grade Correlation Summary
| Measurement | Spanish American | Finnish |
| Minimum | 89.6% | 97.9% |
| Maximum | 100.0% | 100.0% |
| Range | 10.4% | 2.1% |
| Mean | 98.9% | 99.4% |
| Median | 99.6% | 99.4% |
| Interquartile 25% (IQ1) | 98.4% | 99.2% |
| Interquartile 75% (IQ3) | 100.0% | 99.9% |
| Interquartile Range (IQR) | 1.6% | 0.70% |
| Standard Deviation (Sample) | 1.9% | 0.48% |
| Standard Deviation (Population) | 1.9% | 0.47% |
Similar Demographics by 2nd Grade
Demographics Similar to Spanish Americans by 2nd Grade
In terms of 2nd grade, the demographic groups most similar to Spanish Americans are Ugandan (97.9%, a difference of 0.0%), Immigrants from Jordan (97.9%, a difference of 0.0%), Chilean (97.9%, a difference of 0.0%), Brazilian (97.9%, a difference of 0.0%), and Immigrants from Spain (97.9%, a difference of 0.0%).
| Demographics | Rating | Rank | 2nd Grade |
| Immigrants | Iran | 62.8 /100 | #158 | Good 97.9% |
| Comanche | 62.8 /100 | #159 | Good 97.9% |
| Immigrants | Eastern Europe | 61.1 /100 | #160 | Good 97.9% |
| Immigrants | Russia | 60.3 /100 | #161 | Good 97.9% |
| Immigrants | Italy | 60.2 /100 | #162 | Good 97.9% |
| Bermudans | 59.4 /100 | #163 | Average 97.9% |
| Ugandans | 56.6 /100 | #164 | Average 97.9% |
| Spanish Americans | 56.4 /100 | #165 | Average 97.9% |
| Immigrants | Jordan | 56.3 /100 | #166 | Average 97.9% |
| Chileans | 56.1 /100 | #167 | Average 97.9% |
| Brazilians | 55.8 /100 | #168 | Average 97.9% |
| Immigrants | Spain | 55.4 /100 | #169 | Average 97.9% |
| Navajo | 54.3 /100 | #170 | Average 97.9% |
| Albanians | 52.8 /100 | #171 | Average 97.9% |
| Immigrants | Korea | 52.7 /100 | #172 | Average 97.9% |
Demographics Similar to Finns by 2nd Grade
In terms of 2nd grade, the demographic groups most similar to Finns are Sioux (98.5%, a difference of 0.0%), Lithuanian (98.5%, a difference of 0.0%), Polish (98.5%, a difference of 0.0%), Danish (98.5%, a difference of 0.0%), and Pennsylvania German (98.5%, a difference of 0.0%).
| Demographics | Rating | Rank | 2nd Grade |
| Carpatho Rusyns | 100.0 /100 | #12 | Exceptional 98.6% |
| English | 100.0 /100 | #13 | Exceptional 98.6% |
| Swedes | 100.0 /100 | #14 | Exceptional 98.6% |
| Scottish | 100.0 /100 | #15 | Exceptional 98.6% |
| Dutch | 100.0 /100 | #16 | Exceptional 98.6% |
| Aleuts | 100.0 /100 | #17 | Exceptional 98.6% |
| Irish | 100.0 /100 | #18 | Exceptional 98.6% |
| Finns | 100.0 /100 | #19 | Exceptional 98.5% |
| Sioux | 100.0 /100 | #20 | Exceptional 98.5% |
| Lithuanians | 100.0 /100 | #21 | Exceptional 98.5% |
| Poles | 100.0 /100 | #22 | Exceptional 98.5% |
| Danes | 100.0 /100 | #23 | Exceptional 98.5% |
| Pennsylvania Germans | 100.0 /100 | #24 | Exceptional 98.5% |
| Scotch-Irish | 100.0 /100 | #25 | Exceptional 98.5% |
| Welsh | 100.0 /100 | #26 | Exceptional 98.5% |