Immigrants from Pakistan vs Finnish Doctorate Degree
COMPARE
Immigrants from Pakistan
Finnish
Doctorate Degree
Doctorate Degree Comparison
Immigrants from Pakistan
Finns
2.1%
DOCTORATE DEGREE
97.1/ 100
METRIC RATING
111th/ 347
METRIC RANK
1.8%
DOCTORATE DEGREE
42.1/ 100
METRIC RATING
183rd/ 347
METRIC RANK
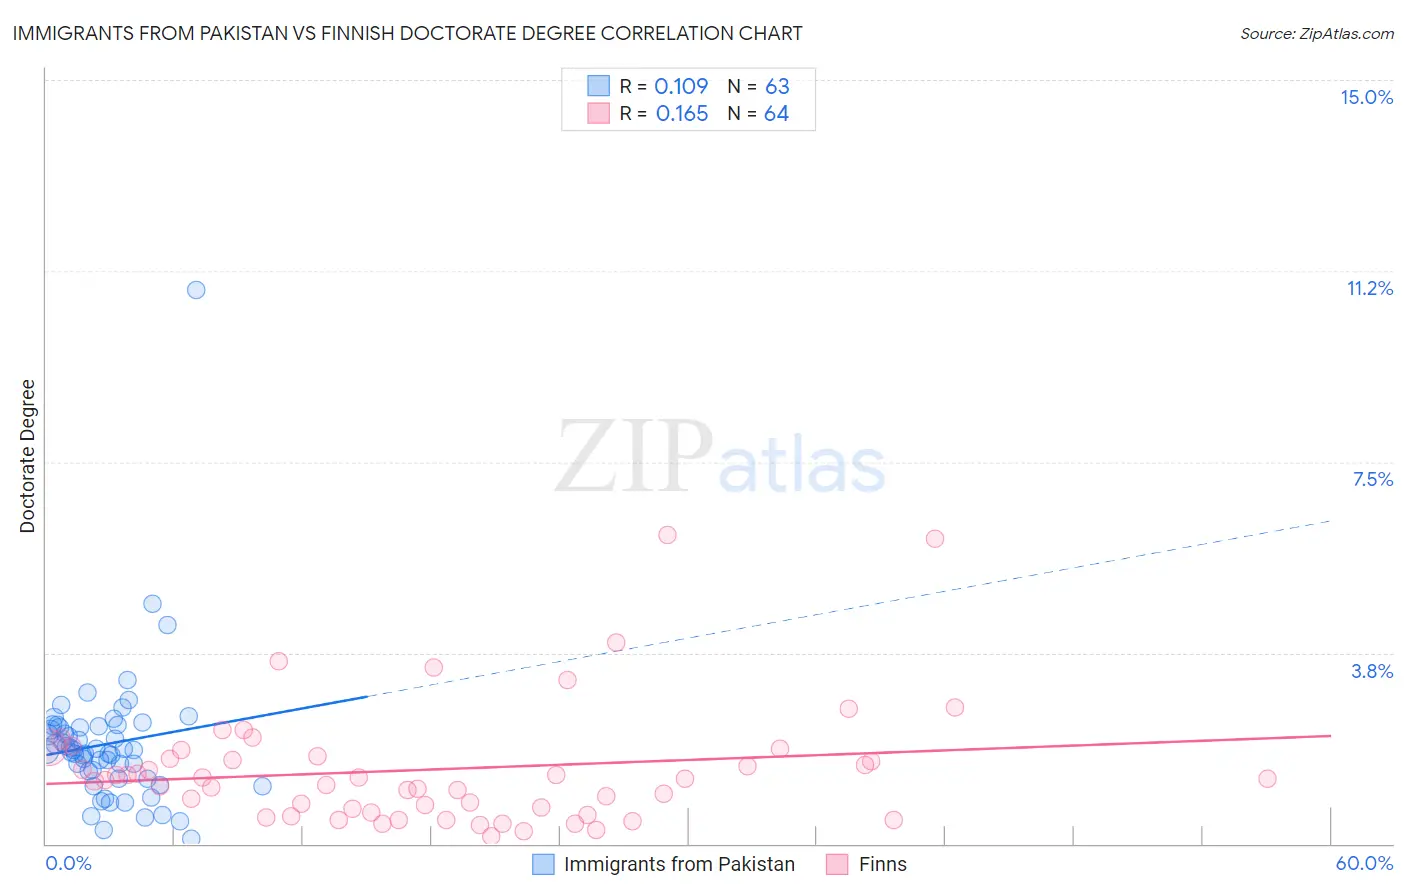
Immigrants from Pakistan vs Finnish Doctorate Degree Correlation Chart
The statistical analysis conducted on geographies consisting of 283,055,701 people shows a poor positive correlation between the proportion of Immigrants from Pakistan and percentage of population with at least doctorate degree education in the United States with a correlation coefficient (R) of 0.109 and weighted average of 2.1%. Similarly, the statistical analysis conducted on geographies consisting of 399,063,308 people shows a poor positive correlation between the proportion of Finns and percentage of population with at least doctorate degree education in the United States with a correlation coefficient (R) of 0.165 and weighted average of 1.8%, a difference of 14.2%.
Doctorate Degree Correlation Summary
| Measurement | Immigrants from Pakistan | Finnish |
| Minimum | 0.090% | 0.15% |
| Maximum | 10.9% | 6.1% |
| Range | 10.8% | 5.9% |
| Mean | 2.0% | 1.5% |
| Median | 1.8% | 1.3% |
| Interquartile 25% (IQ1) | 1.3% | 0.66% |
| Interquartile 75% (IQ3) | 2.3% | 1.8% |
| Interquartile Range (IQR) | 1.0% | 1.1% |
| Standard Deviation (Sample) | 1.4% | 1.2% |
| Standard Deviation (Population) | 1.4% | 1.2% |
Similar Demographics by Doctorate Degree
Demographics Similar to Immigrants from Pakistan by Doctorate Degree
In terms of doctorate degree, the demographic groups most similar to Immigrants from Pakistan are Syrian (2.1%, a difference of 0.020%), Brazilian (2.1%, a difference of 0.060%), Ukrainian (2.1%, a difference of 0.13%), Immigrants from Germany (2.1%, a difference of 0.19%), and Immigrants from Italy (2.1%, a difference of 0.23%).
| Demographics | Rating | Rank | Doctorate Degree |
| Austrians | 98.0 /100 | #104 | Exceptional 2.1% |
| Arabs | 97.8 /100 | #105 | Exceptional 2.1% |
| Sudanese | 97.7 /100 | #106 | Exceptional 2.1% |
| Europeans | 97.5 /100 | #107 | Exceptional 2.1% |
| Immigrants | Germany | 97.3 /100 | #108 | Exceptional 2.1% |
| Ukrainians | 97.2 /100 | #109 | Exceptional 2.1% |
| Brazilians | 97.2 /100 | #110 | Exceptional 2.1% |
| Immigrants | Pakistan | 97.1 /100 | #111 | Exceptional 2.1% |
| Syrians | 97.1 /100 | #112 | Exceptional 2.1% |
| Immigrants | Italy | 96.9 /100 | #113 | Exceptional 2.1% |
| Immigrants | Croatia | 96.8 /100 | #114 | Exceptional 2.1% |
| Taiwanese | 96.7 /100 | #115 | Exceptional 2.1% |
| Maltese | 96.2 /100 | #116 | Exceptional 2.1% |
| Lebanese | 96.0 /100 | #117 | Exceptional 2.1% |
| Icelanders | 96.0 /100 | #118 | Exceptional 2.1% |
Demographics Similar to Finns by Doctorate Degree
In terms of doctorate degree, the demographic groups most similar to Finns are Nigerian (1.8%, a difference of 0.33%), Immigrants from Afghanistan (1.8%, a difference of 0.34%), Immigrants (1.8%, a difference of 0.63%), Scandinavian (1.8%, a difference of 0.89%), and Slovak (1.8%, a difference of 0.90%).
| Demographics | Rating | Rank | Doctorate Degree |
| Spanish | 49.3 /100 | #176 | Average 1.8% |
| Iraqis | 49.2 /100 | #177 | Average 1.8% |
| French | 48.8 /100 | #178 | Average 1.8% |
| Ghanaians | 48.3 /100 | #179 | Average 1.8% |
| Scandinavians | 48.0 /100 | #180 | Average 1.8% |
| Immigrants | Immigrants | 46.2 /100 | #181 | Average 1.8% |
| Immigrants | Afghanistan | 44.3 /100 | #182 | Average 1.8% |
| Finns | 42.1 /100 | #183 | Average 1.8% |
| Nigerians | 39.9 /100 | #184 | Fair 1.8% |
| Slovaks | 36.4 /100 | #185 | Fair 1.8% |
| Peruvians | 34.4 /100 | #186 | Fair 1.8% |
| Czechoslovakians | 33.0 /100 | #187 | Fair 1.8% |
| Germans | 30.5 /100 | #188 | Fair 1.8% |
| French Canadians | 30.2 /100 | #189 | Fair 1.8% |
| Immigrants | Costa Rica | 30.2 /100 | #190 | Fair 1.8% |