Spanish American Indian vs Cuban 12th Grade, No Diploma
COMPARE
Spanish American Indian
Cuban
12th Grade, No Diploma
12th Grade, No Diploma Comparison
Spanish American Indians
Cubans
82.9%
12TH GRADE, NO DIPLOMA
0.0/ 100
METRIC RATING
345th/ 347
METRIC RANK
88.9%
12TH GRADE, NO DIPLOMA
0.0/ 100
METRIC RATING
281st/ 347
METRIC RANK
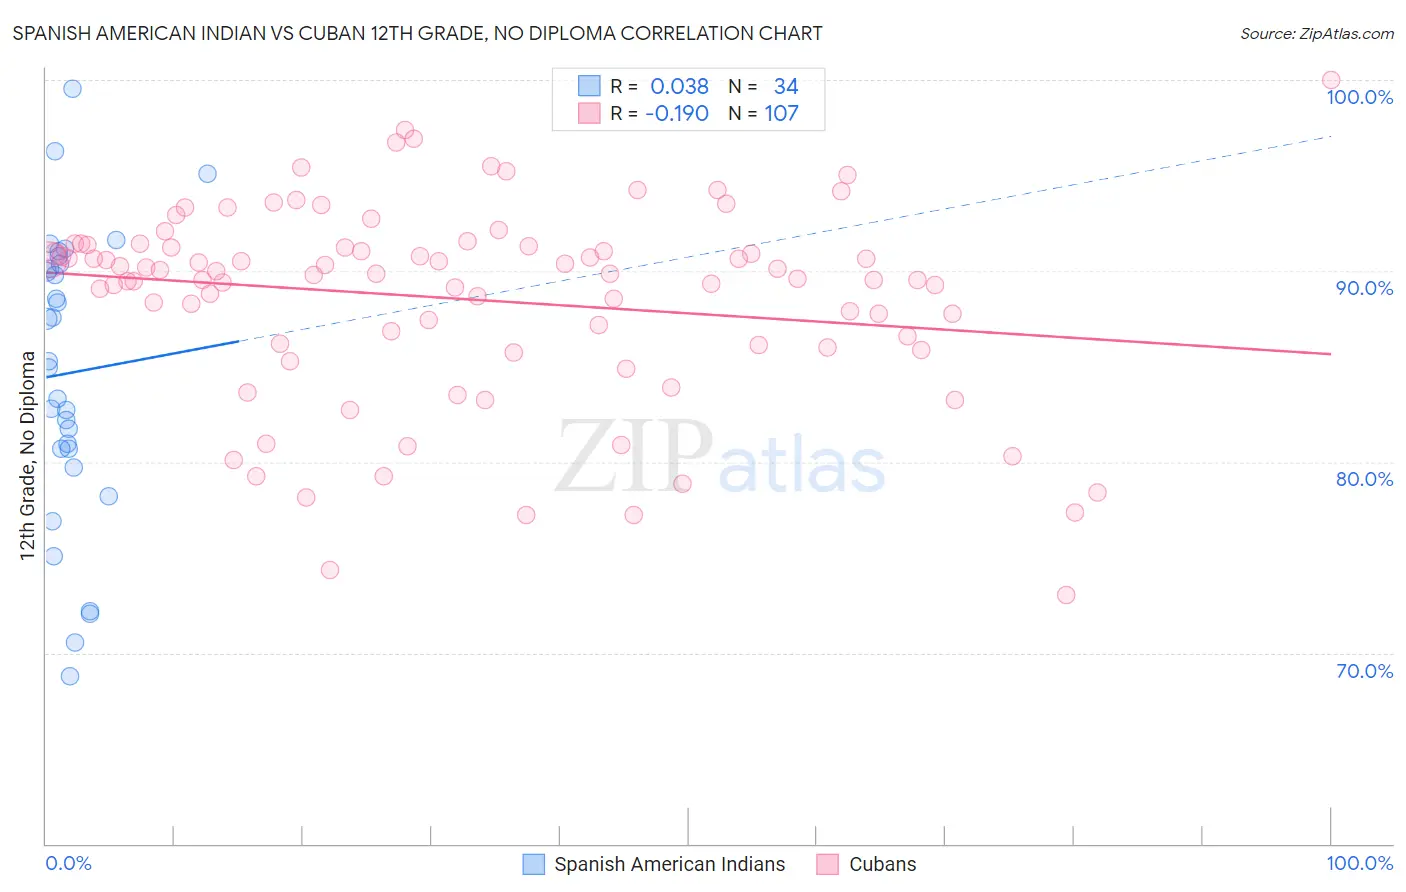
Spanish American Indian vs Cuban 12th Grade, No Diploma Correlation Chart
The statistical analysis conducted on geographies consisting of 73,147,813 people shows no correlation between the proportion of Spanish American Indians and percentage of population with at least 12th grade (no diploma) education in the United States with a correlation coefficient (R) of 0.038 and weighted average of 82.9%. Similarly, the statistical analysis conducted on geographies consisting of 449,351,555 people shows a poor negative correlation between the proportion of Cubans and percentage of population with at least 12th grade (no diploma) education in the United States with a correlation coefficient (R) of -0.190 and weighted average of 88.9%, a difference of 7.2%.
12th Grade, No Diploma Correlation Summary
| Measurement | Spanish American Indian | Cuban |
| Minimum | 68.8% | 73.0% |
| Maximum | 99.5% | 100.0% |
| Range | 30.7% | 27.0% |
| Mean | 84.6% | 88.5% |
| Median | 85.1% | 89.8% |
| Interquartile 25% (IQ1) | 80.7% | 86.1% |
| Interquartile 75% (IQ3) | 90.4% | 91.3% |
| Interquartile Range (IQR) | 9.7% | 5.2% |
| Standard Deviation (Sample) | 7.6% | 5.2% |
| Standard Deviation (Population) | 7.5% | 5.2% |
Similar Demographics by 12th Grade, No Diploma
Demographics Similar to Spanish American Indians by 12th Grade, No Diploma
In terms of 12th grade, no diploma, the demographic groups most similar to Spanish American Indians are Immigrants from Central America (83.0%, a difference of 0.070%), Yakama (82.5%, a difference of 0.53%), Immigrants from Mexico (82.4%, a difference of 0.58%), Immigrants from El Salvador (83.6%, a difference of 0.80%), and Houma (83.7%, a difference of 0.97%).
| Demographics | Rating | Rank | 12th Grade, No Diploma |
| Immigrants | Latin America | 0.0 /100 | #333 | Tragic 85.0% |
| Immigrants | Dominican Republic | 0.0 /100 | #334 | Tragic 84.9% |
| Immigrants | Yemen | 0.0 /100 | #335 | Tragic 84.8% |
| Tohono O'odham | 0.0 /100 | #336 | Tragic 84.7% |
| Pima | 0.0 /100 | #337 | Tragic 84.6% |
| Guatemalans | 0.0 /100 | #338 | Tragic 84.6% |
| Salvadorans | 0.0 /100 | #339 | Tragic 84.5% |
| Mexicans | 0.0 /100 | #340 | Tragic 84.1% |
| Immigrants | Guatemala | 0.0 /100 | #341 | Tragic 84.0% |
| Houma | 0.0 /100 | #342 | Tragic 83.7% |
| Immigrants | El Salvador | 0.0 /100 | #343 | Tragic 83.6% |
| Immigrants | Central America | 0.0 /100 | #344 | Tragic 83.0% |
| Spanish American Indians | 0.0 /100 | #345 | Tragic 82.9% |
| Yakama | 0.0 /100 | #346 | Tragic 82.5% |
| Immigrants | Mexico | 0.0 /100 | #347 | Tragic 82.4% |
Demographics Similar to Cubans by 12th Grade, No Diploma
In terms of 12th grade, no diploma, the demographic groups most similar to Cubans are Immigrants from Laos (88.9%, a difference of 0.010%), Immigrants from Burma/Myanmar (88.9%, a difference of 0.010%), Immigrants from St. Vincent and the Grenadines (88.9%, a difference of 0.080%), Immigrants from Barbados (89.0%, a difference of 0.15%), and Immigrants from Vietnam (88.7%, a difference of 0.17%).
| Demographics | Rating | Rank | 12th Grade, No Diploma |
| Cajuns | 0.1 /100 | #274 | Tragic 89.1% |
| Immigrants | Congo | 0.1 /100 | #275 | Tragic 89.0% |
| Ute | 0.1 /100 | #276 | Tragic 89.0% |
| Immigrants | Barbados | 0.0 /100 | #277 | Tragic 89.0% |
| Immigrants | St. Vincent and the Grenadines | 0.0 /100 | #278 | Tragic 88.9% |
| Immigrants | Laos | 0.0 /100 | #279 | Tragic 88.9% |
| Immigrants | Burma/Myanmar | 0.0 /100 | #280 | Tragic 88.9% |
| Cubans | 0.0 /100 | #281 | Tragic 88.9% |
| Immigrants | Vietnam | 0.0 /100 | #282 | Tragic 88.7% |
| Paiute | 0.0 /100 | #283 | Tragic 88.7% |
| Pennsylvania Germans | 0.0 /100 | #284 | Tragic 88.7% |
| Indonesians | 0.0 /100 | #285 | Tragic 88.6% |
| Immigrants | West Indies | 0.0 /100 | #286 | Tragic 88.6% |
| Hopi | 0.0 /100 | #287 | Tragic 88.6% |
| Immigrants | Fiji | 0.0 /100 | #288 | Tragic 88.6% |