Chinese vs Syrian High School Diploma
COMPARE
Chinese
Syrian
High School Diploma
High School Diploma Comparison
Chinese
Syrians
92.0%
HIGH SCHOOL DIPLOMA
100.0/ 100
METRIC RATING
8th/ 347
METRIC RANK
90.3%
HIGH SCHOOL DIPLOMA
97.0/ 100
METRIC RATING
106th/ 347
METRIC RANK
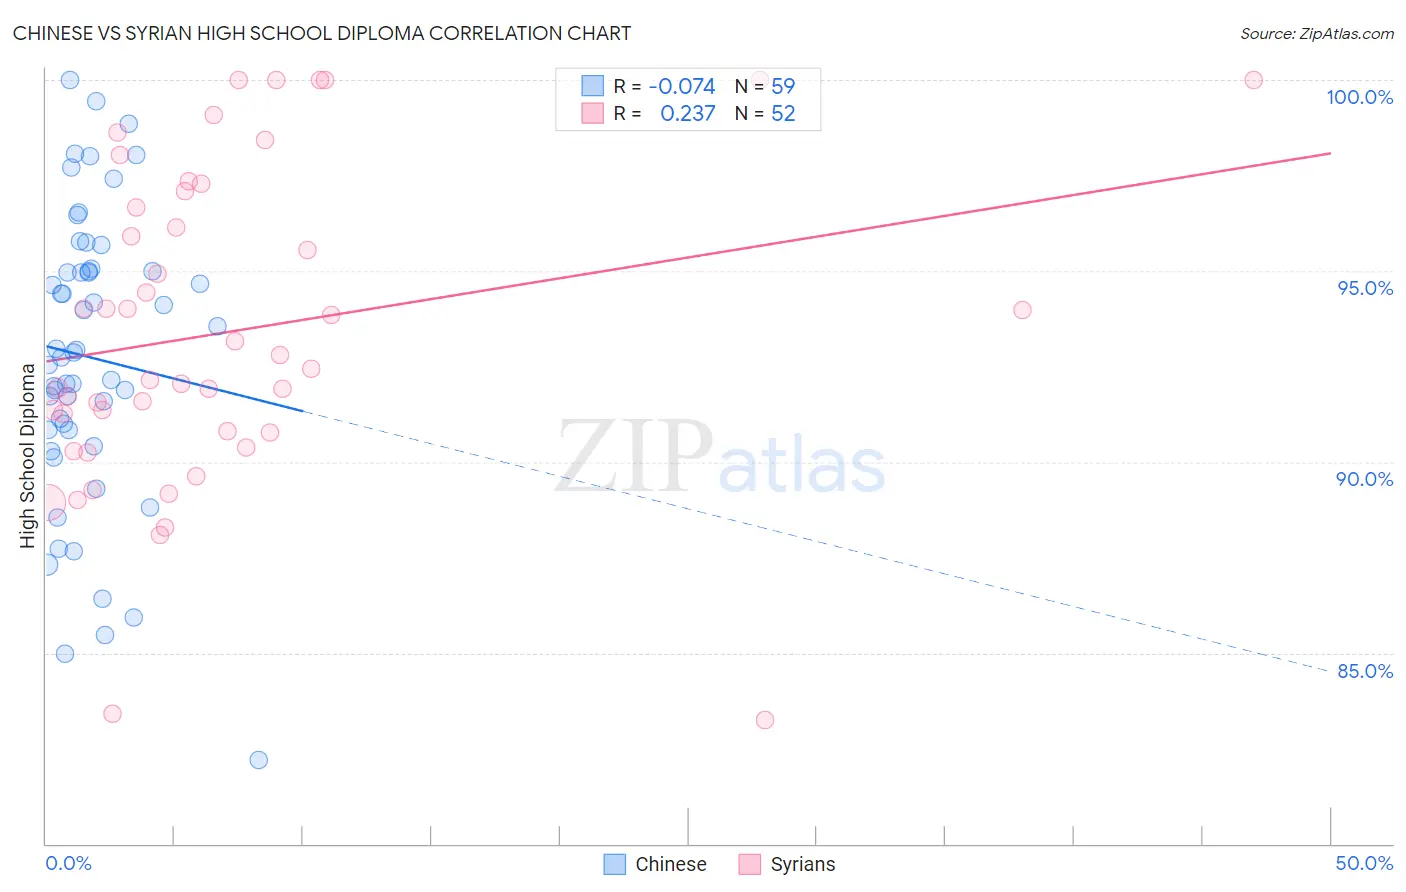
Chinese vs Syrian High School Diploma Correlation Chart
The statistical analysis conducted on geographies consisting of 64,809,883 people shows a slight negative correlation between the proportion of Chinese and percentage of population with at least high school diploma education in the United States with a correlation coefficient (R) of -0.074 and weighted average of 92.0%. Similarly, the statistical analysis conducted on geographies consisting of 266,306,452 people shows a weak positive correlation between the proportion of Syrians and percentage of population with at least high school diploma education in the United States with a correlation coefficient (R) of 0.237 and weighted average of 90.3%, a difference of 1.9%.
High School Diploma Correlation Summary
| Measurement | Chinese | Syrian |
| Minimum | 82.2% | 83.2% |
| Maximum | 100.0% | 100.0% |
| Range | 17.8% | 16.8% |
| Mean | 92.7% | 93.4% |
| Median | 92.9% | 92.6% |
| Interquartile 25% (IQ1) | 90.8% | 90.8% |
| Interquartile 75% (IQ3) | 95.0% | 96.9% |
| Interquartile Range (IQR) | 4.1% | 6.1% |
| Standard Deviation (Sample) | 3.8% | 4.1% |
| Standard Deviation (Population) | 3.8% | 4.1% |
Similar Demographics by High School Diploma
Demographics Similar to Chinese by High School Diploma
In terms of high school diploma, the demographic groups most similar to Chinese are Immigrants from India (92.0%, a difference of 0.010%), Latvian (92.0%, a difference of 0.010%), Slovak (92.0%, a difference of 0.020%), Lithuanian (92.0%, a difference of 0.040%), and Slovene (92.0%, a difference of 0.040%).
| Demographics | Rating | Rank | High School Diploma |
| Norwegians | 100.0 /100 | #1 | Exceptional 92.5% |
| Swedes | 100.0 /100 | #2 | Exceptional 92.2% |
| Carpatho Rusyns | 100.0 /100 | #3 | Exceptional 92.1% |
| Lithuanians | 100.0 /100 | #4 | Exceptional 92.0% |
| Slovenes | 100.0 /100 | #5 | Exceptional 92.0% |
| Slovaks | 100.0 /100 | #6 | Exceptional 92.0% |
| Immigrants | India | 100.0 /100 | #7 | Exceptional 92.0% |
| Chinese | 100.0 /100 | #8 | Exceptional 92.0% |
| Latvians | 100.0 /100 | #9 | Exceptional 92.0% |
| Croatians | 100.0 /100 | #10 | Exceptional 92.0% |
| Eastern Europeans | 100.0 /100 | #11 | Exceptional 91.9% |
| Poles | 100.0 /100 | #12 | Exceptional 91.9% |
| Danes | 100.0 /100 | #13 | Exceptional 91.8% |
| Bulgarians | 100.0 /100 | #14 | Exceptional 91.8% |
| Luxembourgers | 100.0 /100 | #15 | Exceptional 91.7% |
Demographics Similar to Syrians by High School Diploma
In terms of high school diploma, the demographic groups most similar to Syrians are Immigrants from Russia (90.3%, a difference of 0.020%), Palestinian (90.3%, a difference of 0.030%), Immigrants from Zimbabwe (90.3%, a difference of 0.030%), Lebanese (90.4%, a difference of 0.050%), and Immigrants from Greece (90.3%, a difference of 0.050%).
| Demographics | Rating | Rank | High School Diploma |
| Immigrants | Europe | 98.2 /100 | #99 | Exceptional 90.5% |
| Immigrants | North Macedonia | 98.1 /100 | #100 | Exceptional 90.5% |
| Immigrants | Norway | 98.0 /100 | #101 | Exceptional 90.5% |
| Aleuts | 98.0 /100 | #102 | Exceptional 90.4% |
| Immigrants | Romania | 97.8 /100 | #103 | Exceptional 90.4% |
| Immigrants | Croatia | 97.8 /100 | #104 | Exceptional 90.4% |
| Lebanese | 97.4 /100 | #105 | Exceptional 90.4% |
| Syrians | 97.0 /100 | #106 | Exceptional 90.3% |
| Immigrants | Russia | 96.9 /100 | #107 | Exceptional 90.3% |
| Palestinians | 96.7 /100 | #108 | Exceptional 90.3% |
| Immigrants | Zimbabwe | 96.7 /100 | #109 | Exceptional 90.3% |
| Immigrants | Greece | 96.6 /100 | #110 | Exceptional 90.3% |
| Menominee | 96.6 /100 | #111 | Exceptional 90.3% |
| Immigrants | Belarus | 96.4 /100 | #112 | Exceptional 90.2% |
| Immigrants | Sri Lanka | 96.3 /100 | #113 | Exceptional 90.2% |