Spaniard vs Immigrants from Korea 11th Grade
COMPARE
Spaniard
Immigrants from Korea
11th Grade
11th Grade Comparison
Spaniards
Immigrants from Korea
92.5%
11TH GRADE
46.9/ 100
METRIC RATING
176th/ 347
METRIC RANK
93.3%
11TH GRADE
97.0/ 100
METRIC RATING
118th/ 347
METRIC RANK
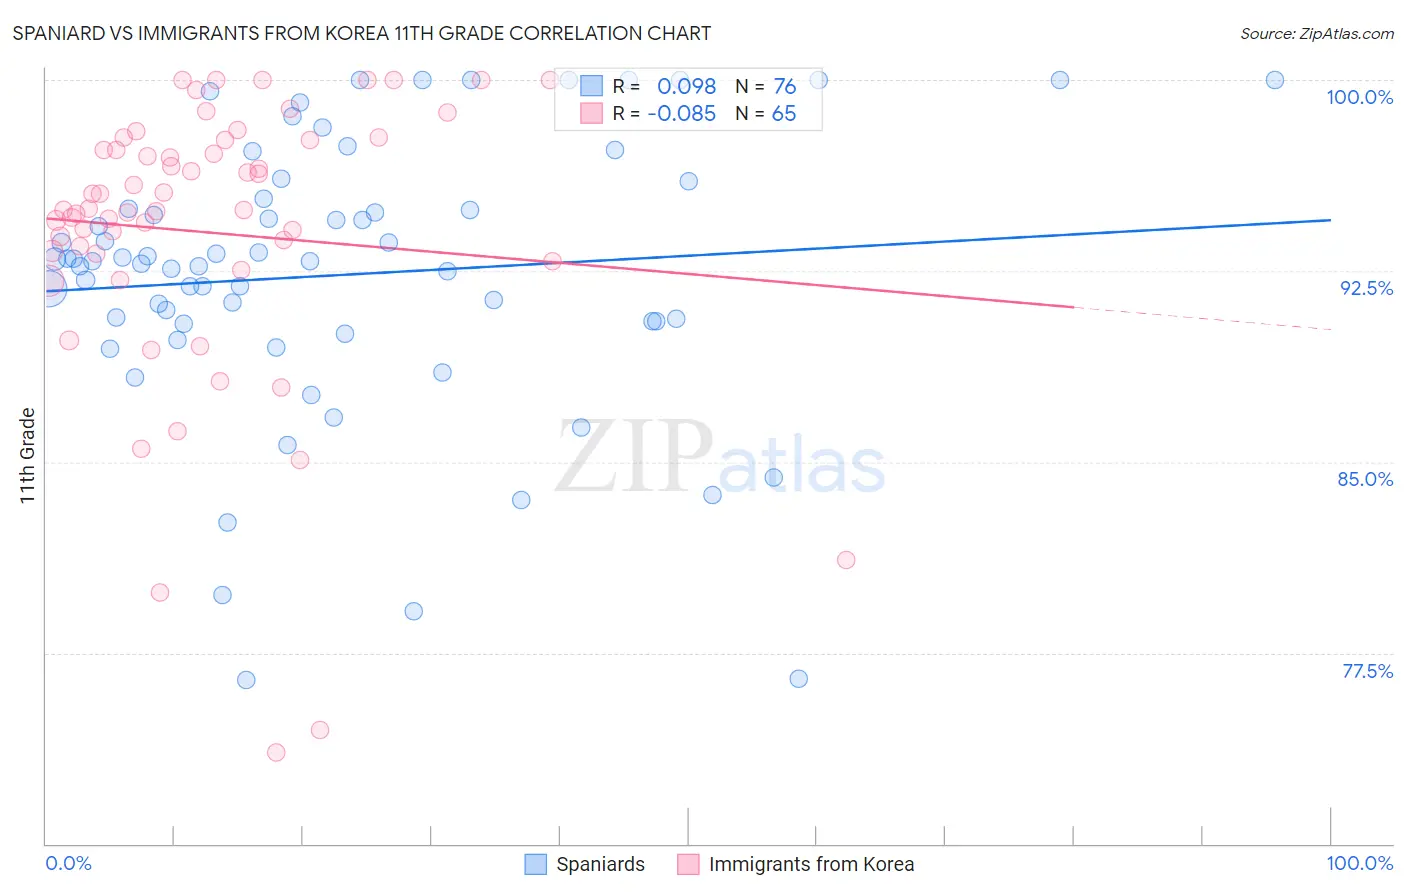
Spaniard vs Immigrants from Korea 11th Grade Correlation Chart
The statistical analysis conducted on geographies consisting of 443,545,794 people shows a slight positive correlation between the proportion of Spaniards and percentage of population with at least 11th grade education in the United States with a correlation coefficient (R) of 0.098 and weighted average of 92.5%. Similarly, the statistical analysis conducted on geographies consisting of 416,280,217 people shows a slight negative correlation between the proportion of Immigrants from Korea and percentage of population with at least 11th grade education in the United States with a correlation coefficient (R) of -0.085 and weighted average of 93.3%, a difference of 0.88%.
11th Grade Correlation Summary
| Measurement | Spaniard | Immigrants from Korea |
| Minimum | 76.4% | 73.6% |
| Maximum | 100.0% | 100.0% |
| Range | 23.6% | 26.4% |
| Mean | 92.3% | 94.0% |
| Median | 92.9% | 94.9% |
| Interquartile 25% (IQ1) | 90.5% | 93.0% |
| Interquartile 75% (IQ3) | 95.1% | 97.6% |
| Interquartile Range (IQR) | 4.6% | 4.6% |
| Standard Deviation (Sample) | 5.4% | 5.7% |
| Standard Deviation (Population) | 5.4% | 5.6% |
Similar Demographics by 11th Grade
Demographics Similar to Spaniards by 11th Grade
In terms of 11th grade, the demographic groups most similar to Spaniards are Shoshone (92.5%, a difference of 0.020%), Guamanian/Chamorro (92.5%, a difference of 0.020%), Asian (92.5%, a difference of 0.030%), Sudanese (92.5%, a difference of 0.030%), and Immigrants from Pakistan (92.5%, a difference of 0.050%).
| Demographics | Rating | Rank | 11th Grade |
| Immigrants | Albania | 57.8 /100 | #169 | Average 92.6% |
| Immigrants | Northern Africa | 57.3 /100 | #170 | Average 92.6% |
| Laotians | 54.4 /100 | #171 | Average 92.6% |
| Immigrants | Pakistan | 52.3 /100 | #172 | Average 92.5% |
| Indians (Asian) | 51.5 /100 | #173 | Average 92.5% |
| Asians | 50.0 /100 | #174 | Average 92.5% |
| Shoshone | 48.9 /100 | #175 | Average 92.5% |
| Spaniards | 46.9 /100 | #176 | Average 92.5% |
| Guamanians/Chamorros | 45.0 /100 | #177 | Average 92.5% |
| Sudanese | 43.4 /100 | #178 | Average 92.5% |
| Creek | 40.9 /100 | #179 | Average 92.4% |
| Inupiat | 40.7 /100 | #180 | Average 92.4% |
| Cherokee | 40.7 /100 | #181 | Average 92.4% |
| Immigrants | Morocco | 38.6 /100 | #182 | Fair 92.4% |
| Immigrants | Malaysia | 37.6 /100 | #183 | Fair 92.4% |
Demographics Similar to Immigrants from Korea by 11th Grade
In terms of 11th grade, the demographic groups most similar to Immigrants from Korea are Israeli (93.3%, a difference of 0.0%), Immigrants from Russia (93.3%, a difference of 0.030%), White/Caucasian (93.3%, a difference of 0.040%), Immigrants from Hungary (93.4%, a difference of 0.050%), and German Russian (93.3%, a difference of 0.050%).
| Demographics | Rating | Rank | 11th Grade |
| Yugoslavians | 98.1 /100 | #111 | Exceptional 93.4% |
| Immigrants | Germany | 98.0 /100 | #112 | Exceptional 93.4% |
| Immigrants | Zimbabwe | 97.8 /100 | #113 | Exceptional 93.4% |
| Jordanians | 97.8 /100 | #114 | Exceptional 93.4% |
| Palestinians | 97.7 /100 | #115 | Exceptional 93.4% |
| Immigrants | Hungary | 97.5 /100 | #116 | Exceptional 93.4% |
| Whites/Caucasians | 97.4 /100 | #117 | Exceptional 93.3% |
| Immigrants | Korea | 97.0 /100 | #118 | Exceptional 93.3% |
| Israelis | 97.0 /100 | #119 | Exceptional 93.3% |
| Immigrants | Russia | 96.6 /100 | #120 | Exceptional 93.3% |
| German Russians | 96.4 /100 | #121 | Exceptional 93.3% |
| Immigrants | Belarus | 96.3 /100 | #122 | Exceptional 93.3% |
| Immigrants | Greece | 95.9 /100 | #123 | Exceptional 93.2% |
| Immigrants | Eastern Europe | 95.9 /100 | #124 | Exceptional 93.2% |
| Immigrants | Sri Lanka | 95.6 /100 | #125 | Exceptional 93.2% |