Nonimmigrants vs Immigrants from Syria 6th Grade
COMPARE
Nonimmigrants
Immigrants from Syria
6th Grade
6th Grade Comparison
Nonimmigrants
Immigrants from Syria
97.4%
6TH GRADE
97.3/ 100
METRIC RATING
108th/ 347
METRIC RANK
96.7%
6TH GRADE
5.9/ 100
METRIC RATING
222nd/ 347
METRIC RANK
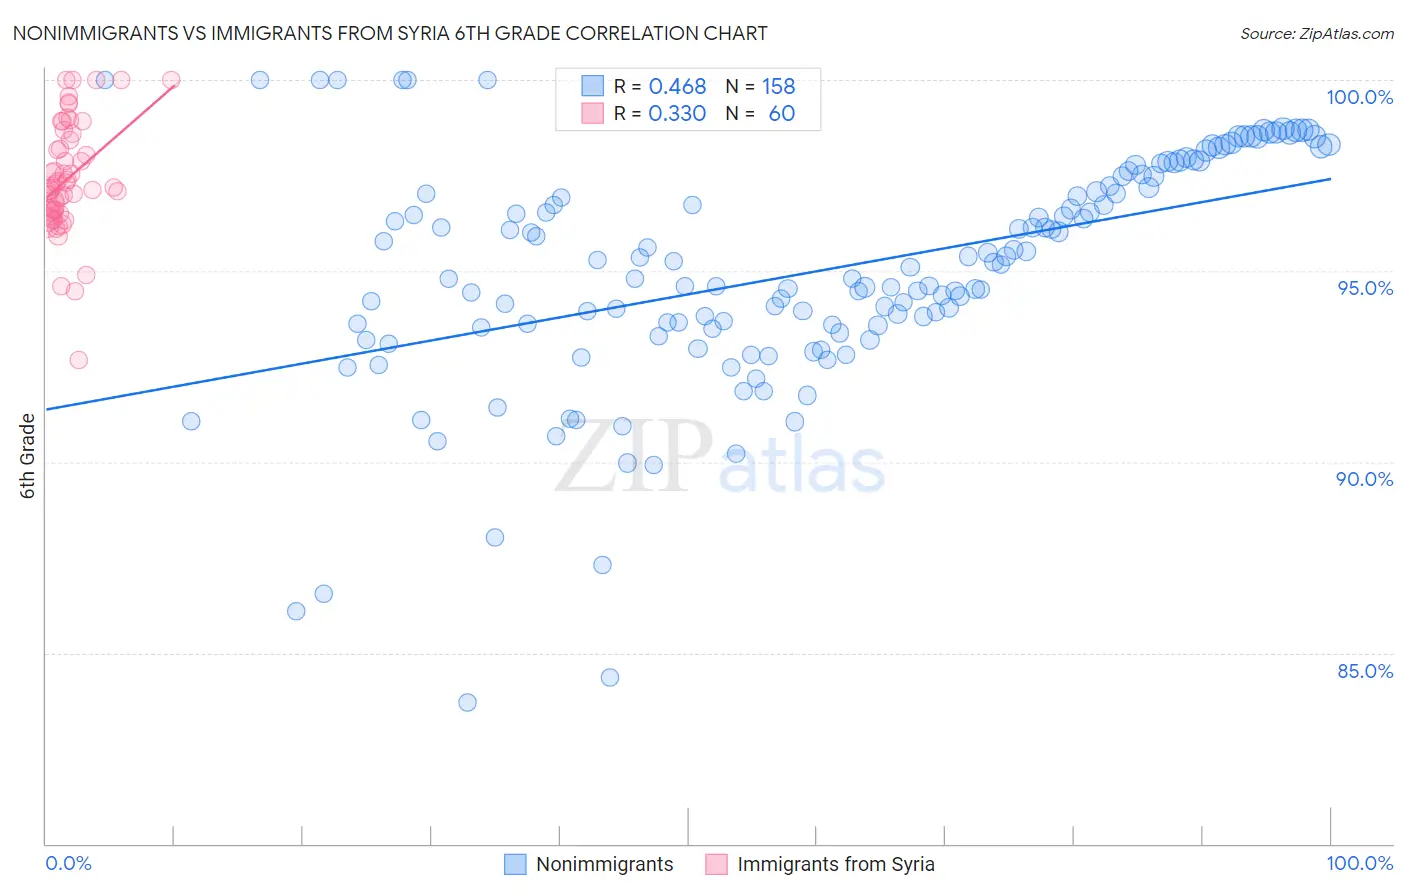
Nonimmigrants vs Immigrants from Syria 6th Grade Correlation Chart
The statistical analysis conducted on geographies consisting of 585,374,489 people shows a moderate positive correlation between the proportion of Nonimmigrants and percentage of population with at least 6th grade education in the United States with a correlation coefficient (R) of 0.468 and weighted average of 97.4%. Similarly, the statistical analysis conducted on geographies consisting of 174,108,374 people shows a mild positive correlation between the proportion of Immigrants from Syria and percentage of population with at least 6th grade education in the United States with a correlation coefficient (R) of 0.330 and weighted average of 96.7%, a difference of 0.73%.
6th Grade Correlation Summary
| Measurement | Nonimmigrants | Immigrants from Syria |
| Minimum | 83.7% | 92.7% |
| Maximum | 100.0% | 100.0% |
| Range | 16.3% | 7.3% |
| Mean | 95.0% | 97.4% |
| Median | 95.1% | 97.2% |
| Interquartile 25% (IQ1) | 93.5% | 96.5% |
| Interquartile 75% (IQ3) | 97.2% | 98.5% |
| Interquartile Range (IQR) | 3.7% | 2.0% |
| Standard Deviation (Sample) | 3.0% | 1.5% |
| Standard Deviation (Population) | 3.0% | 1.5% |
Similar Demographics by 6th Grade
Demographics Similar to Nonimmigrants by 6th Grade
In terms of 6th grade, the demographic groups most similar to Nonimmigrants are Immigrants from Czechoslovakia (97.4%, a difference of 0.0%), Immigrants from Singapore (97.5%, a difference of 0.010%), Menominee (97.5%, a difference of 0.020%), Thai (97.4%, a difference of 0.020%), and Iroquois (97.4%, a difference of 0.020%).
| Demographics | Rating | Rank | 6th Grade |
| South Africans | 98.2 /100 | #101 | Exceptional 97.5% |
| Choctaw | 98.0 /100 | #102 | Exceptional 97.5% |
| Bhutanese | 98.0 /100 | #103 | Exceptional 97.5% |
| German Russians | 97.9 /100 | #104 | Exceptional 97.5% |
| Cheyenne | 97.9 /100 | #105 | Exceptional 97.5% |
| Menominee | 97.7 /100 | #106 | Exceptional 97.5% |
| Immigrants | Singapore | 97.6 /100 | #107 | Exceptional 97.5% |
| Immigrants | Nonimmigrants | 97.3 /100 | #108 | Exceptional 97.4% |
| Immigrants | Czechoslovakia | 97.3 /100 | #109 | Exceptional 97.4% |
| Thais | 96.9 /100 | #110 | Exceptional 97.4% |
| Iroquois | 96.9 /100 | #111 | Exceptional 97.4% |
| Immigrants | Latvia | 96.7 /100 | #112 | Exceptional 97.4% |
| Immigrants | Saudi Arabia | 96.5 /100 | #113 | Exceptional 97.4% |
| Colville | 96.4 /100 | #114 | Exceptional 97.4% |
| Immigrants | Switzerland | 95.7 /100 | #115 | Exceptional 97.4% |
Demographics Similar to Immigrants from Syria by 6th Grade
In terms of 6th grade, the demographic groups most similar to Immigrants from Syria are Tongan (96.7%, a difference of 0.0%), Immigrants from Morocco (96.7%, a difference of 0.010%), Costa Rican (96.8%, a difference of 0.020%), Liberian (96.8%, a difference of 0.030%), and Navajo (96.8%, a difference of 0.030%).
| Demographics | Rating | Rank | 6th Grade |
| Sierra Leoneans | 8.0 /100 | #215 | Tragic 96.8% |
| Paiute | 7.8 /100 | #216 | Tragic 96.8% |
| Liberians | 7.5 /100 | #217 | Tragic 96.8% |
| Navajo | 7.3 /100 | #218 | Tragic 96.8% |
| Costa Ricans | 6.8 /100 | #219 | Tragic 96.8% |
| Immigrants | Morocco | 6.2 /100 | #220 | Tragic 96.7% |
| Tongans | 6.1 /100 | #221 | Tragic 96.7% |
| Immigrants | Syria | 5.9 /100 | #222 | Tragic 96.7% |
| Bahamians | 4.8 /100 | #223 | Tragic 96.7% |
| Immigrants | Southern Europe | 4.4 /100 | #224 | Tragic 96.7% |
| Immigrants | Pakistan | 4.4 /100 | #225 | Tragic 96.7% |
| Immigrants | Panama | 4.2 /100 | #226 | Tragic 96.7% |
| Immigrants | Western Asia | 4.1 /100 | #227 | Tragic 96.7% |
| Immigrants | Malaysia | 4.0 /100 | #228 | Tragic 96.7% |
| Assyrians/Chaldeans/Syriacs | 4.0 /100 | #229 | Tragic 96.7% |