South American Indian vs Immigrants from Asia 6th Grade
COMPARE
South American Indian
Immigrants from Asia
6th Grade
6th Grade Comparison
South American Indians
Immigrants from Asia
96.7%
6TH GRADE
3.5/ 100
METRIC RATING
232nd/ 347
METRIC RANK
96.6%
6TH GRADE
1.8/ 100
METRIC RATING
242nd/ 347
METRIC RANK
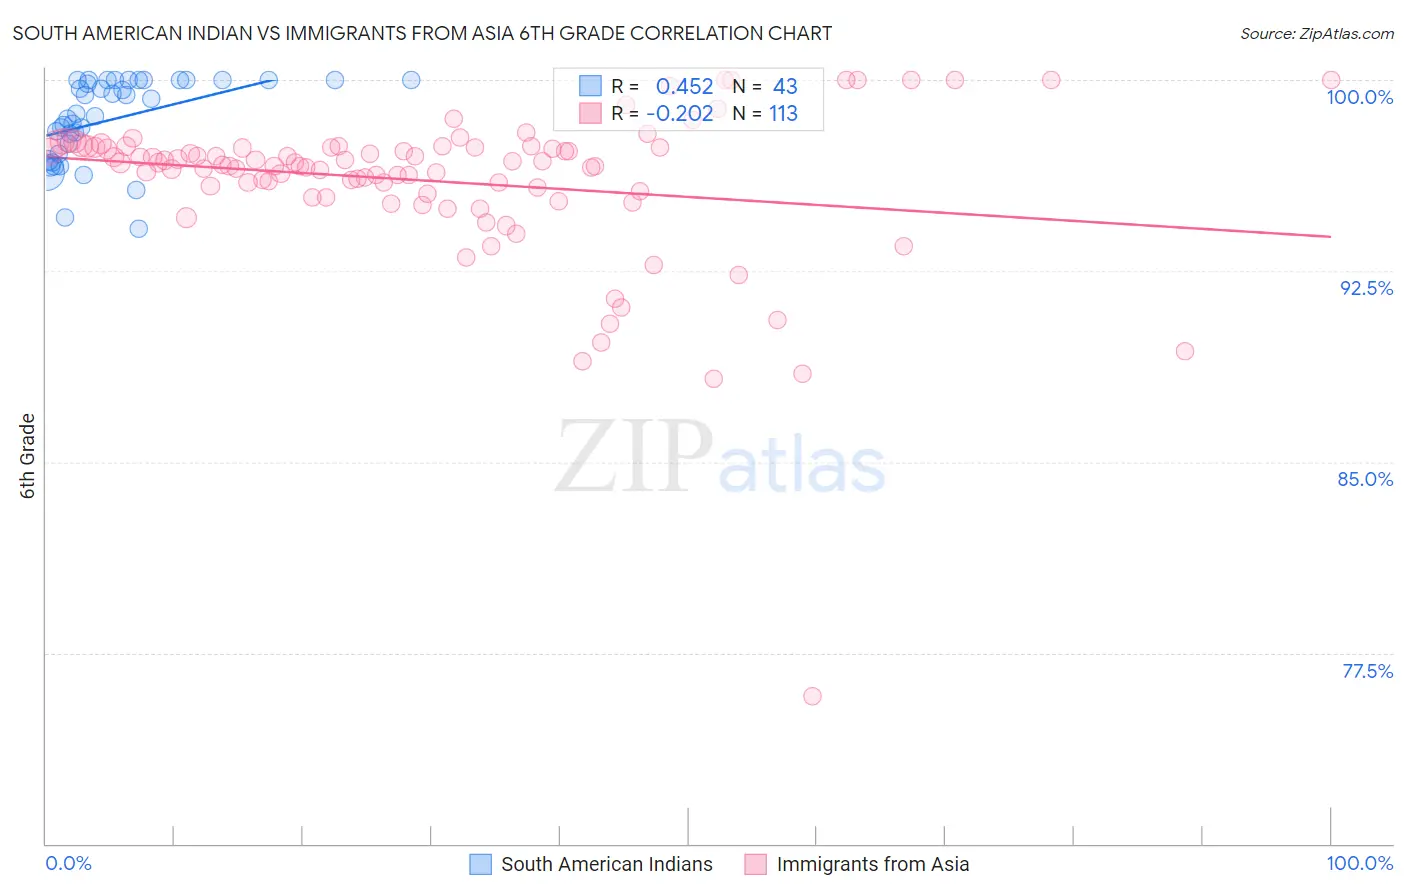
South American Indian vs Immigrants from Asia 6th Grade Correlation Chart
The statistical analysis conducted on geographies consisting of 164,573,401 people shows a moderate positive correlation between the proportion of South American Indians and percentage of population with at least 6th grade education in the United States with a correlation coefficient (R) of 0.452 and weighted average of 96.7%. Similarly, the statistical analysis conducted on geographies consisting of 549,170,438 people shows a weak negative correlation between the proportion of Immigrants from Asia and percentage of population with at least 6th grade education in the United States with a correlation coefficient (R) of -0.202 and weighted average of 96.6%, a difference of 0.080%.
6th Grade Correlation Summary
| Measurement | South American Indian | Immigrants from Asia |
| Minimum | 94.1% | 75.8% |
| Maximum | 100.0% | 100.0% |
| Range | 5.9% | 24.2% |
| Mean | 98.5% | 96.0% |
| Median | 98.7% | 96.8% |
| Interquartile 25% (IQ1) | 97.1% | 95.6% |
| Interquartile 75% (IQ3) | 100.0% | 97.4% |
| Interquartile Range (IQR) | 2.9% | 1.8% |
| Standard Deviation (Sample) | 1.6% | 3.1% |
| Standard Deviation (Population) | 1.6% | 3.1% |
Demographics Similar to South American Indians and Immigrants from Asia by 6th Grade
In terms of 6th grade, the demographic groups most similar to South American Indians are Subsaharan African (96.7%, a difference of 0.0%), Yuman (96.7%, a difference of 0.010%), Immigrants from Western Asia (96.7%, a difference of 0.020%), Immigrants from Malaysia (96.7%, a difference of 0.020%), and Assyrian/Chaldean/Syriac (96.7%, a difference of 0.020%). Similarly, the demographic groups most similar to Immigrants from Asia are Senegalese (96.6%, a difference of 0.0%), Nigerian (96.6%, a difference of 0.010%), Indian (Asian) (96.6%, a difference of 0.010%), Korean (96.6%, a difference of 0.010%), and Immigrants from Liberia (96.6%, a difference of 0.010%).
| Demographics | Rating | Rank | 6th Grade |
| Immigrants | Western Asia | 4.1 /100 | #227 | Tragic 96.7% |
| Immigrants | Malaysia | 4.0 /100 | #228 | Tragic 96.7% |
| Assyrians/Chaldeans/Syriacs | 4.0 /100 | #229 | Tragic 96.7% |
| Immigrants | Eastern Asia | 4.0 /100 | #230 | Tragic 96.7% |
| Sub-Saharan Africans | 3.5 /100 | #231 | Tragic 96.7% |
| South American Indians | 3.5 /100 | #232 | Tragic 96.7% |
| Yuman | 3.2 /100 | #233 | Tragic 96.7% |
| Uruguayans | 2.5 /100 | #234 | Tragic 96.6% |
| Asians | 2.4 /100 | #235 | Tragic 96.6% |
| Immigrants | Indonesia | 2.3 /100 | #236 | Tragic 96.6% |
| Immigrants | Eastern Africa | 2.0 /100 | #237 | Tragic 96.6% |
| Nigerians | 1.9 /100 | #238 | Tragic 96.6% |
| Indians (Asian) | 1.9 /100 | #239 | Tragic 96.6% |
| Koreans | 1.9 /100 | #240 | Tragic 96.6% |
| Senegalese | 1.8 /100 | #241 | Tragic 96.6% |
| Immigrants | Asia | 1.8 /100 | #242 | Tragic 96.6% |
| Immigrants | Liberia | 1.6 /100 | #243 | Tragic 96.6% |
| Ethiopians | 1.5 /100 | #244 | Tragic 96.6% |
| Immigrants | Costa Rica | 1.3 /100 | #245 | Tragic 96.6% |
| Immigrants | Africa | 1.3 /100 | #246 | Tragic 96.6% |
| Bolivians | 1.0 /100 | #247 | Tragic 96.5% |