Puget Sound Salish vs European 8th Grade
COMPARE
Puget Sound Salish
European
8th Grade
8th Grade Comparison
Puget Sound Salish
Europeans
96.5%
8TH GRADE
99.3/ 100
METRIC RATING
79th/ 347
METRIC RANK
97.1%
8TH GRADE
100.0/ 100
METRIC RATING
29th/ 347
METRIC RANK
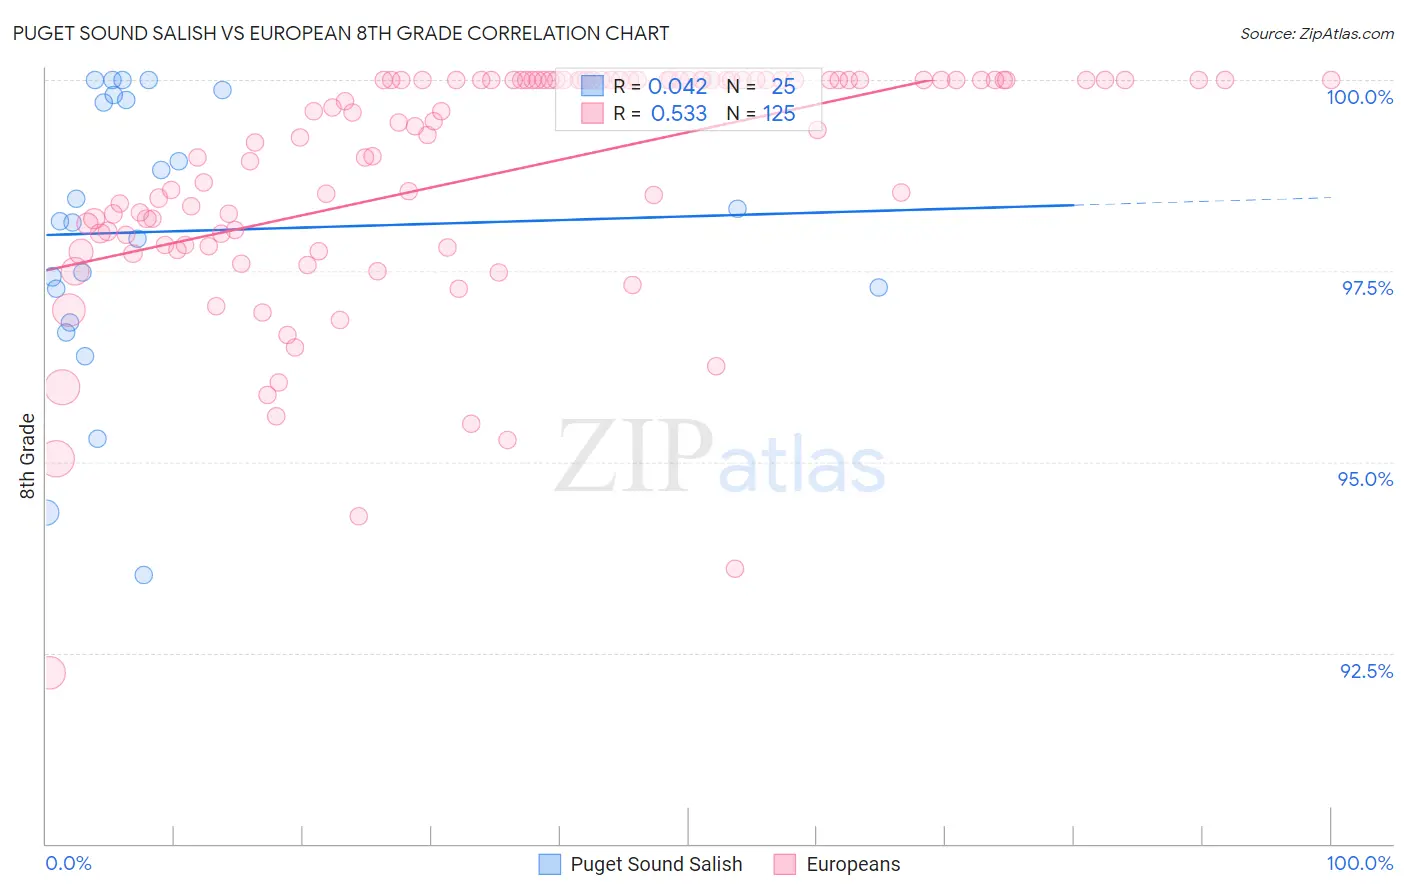
Puget Sound Salish vs European 8th Grade Correlation Chart
The statistical analysis conducted on geographies consisting of 46,155,775 people shows no correlation between the proportion of Puget Sound Salish and percentage of population with at least 8th grade education in the United States with a correlation coefficient (R) of 0.042 and weighted average of 96.5%. Similarly, the statistical analysis conducted on geographies consisting of 561,829,544 people shows a substantial positive correlation between the proportion of Europeans and percentage of population with at least 8th grade education in the United States with a correlation coefficient (R) of 0.533 and weighted average of 97.1%, a difference of 0.62%.
8th Grade Correlation Summary
| Measurement | Puget Sound Salish | European |
| Minimum | 93.5% | 92.2% |
| Maximum | 100.0% | 100.0% |
| Range | 6.5% | 7.8% |
| Mean | 98.0% | 98.8% |
| Median | 98.2% | 99.4% |
| Interquartile 25% (IQ1) | 97.0% | 97.8% |
| Interquartile 75% (IQ3) | 99.8% | 100.0% |
| Interquartile Range (IQR) | 2.7% | 2.2% |
| Standard Deviation (Sample) | 1.8% | 1.6% |
| Standard Deviation (Population) | 1.8% | 1.6% |
Similar Demographics by 8th Grade
Demographics Similar to Puget Sound Salish by 8th Grade
In terms of 8th grade, the demographic groups most similar to Puget Sound Salish are Cypriot (96.5%, a difference of 0.020%), Yugoslavian (96.5%, a difference of 0.020%), Delaware (96.5%, a difference of 0.020%), Romanian (96.5%, a difference of 0.020%), and Turkish (96.5%, a difference of 0.020%).
| Demographics | Rating | Rank | 8th Grade |
| Immigrants | England | 99.5 /100 | #72 | Exceptional 96.6% |
| Arapaho | 99.5 /100 | #73 | Exceptional 96.6% |
| Immigrants | Ireland | 99.5 /100 | #74 | Exceptional 96.5% |
| Zimbabweans | 99.4 /100 | #75 | Exceptional 96.5% |
| Immigrants | Netherlands | 99.4 /100 | #76 | Exceptional 96.5% |
| Cypriots | 99.4 /100 | #77 | Exceptional 96.5% |
| Yugoslavians | 99.4 /100 | #78 | Exceptional 96.5% |
| Puget Sound Salish | 99.3 /100 | #79 | Exceptional 96.5% |
| Delaware | 99.2 /100 | #80 | Exceptional 96.5% |
| Romanians | 99.2 /100 | #81 | Exceptional 96.5% |
| Turks | 99.2 /100 | #82 | Exceptional 96.5% |
| Icelanders | 99.2 /100 | #83 | Exceptional 96.5% |
| Immigrants | Belgium | 99.1 /100 | #84 | Exceptional 96.5% |
| Immigrants | South Africa | 99.1 /100 | #85 | Exceptional 96.5% |
| Cherokee | 99.0 /100 | #86 | Exceptional 96.5% |
Demographics Similar to Europeans by 8th Grade
In terms of 8th grade, the demographic groups most similar to Europeans are Italian (97.1%, a difference of 0.0%), Scotch-Irish (97.1%, a difference of 0.010%), Czech (97.1%, a difference of 0.030%), French (97.1%, a difference of 0.030%), and Sioux (97.1%, a difference of 0.030%).
| Demographics | Rating | Rank | 8th Grade |
| Welsh | 100.0 /100 | #22 | Exceptional 97.2% |
| French Canadians | 100.0 /100 | #23 | Exceptional 97.2% |
| Scandinavians | 100.0 /100 | #24 | Exceptional 97.2% |
| Czechs | 100.0 /100 | #25 | Exceptional 97.1% |
| French | 100.0 /100 | #26 | Exceptional 97.1% |
| Scotch-Irish | 100.0 /100 | #27 | Exceptional 97.1% |
| Italians | 100.0 /100 | #28 | Exceptional 97.1% |
| Europeans | 100.0 /100 | #29 | Exceptional 97.1% |
| Sioux | 100.0 /100 | #30 | Exceptional 97.1% |
| Chippewa | 100.0 /100 | #31 | Exceptional 97.1% |
| Yup'ik | 100.0 /100 | #32 | Exceptional 97.0% |
| Swiss | 100.0 /100 | #33 | Exceptional 97.0% |
| Luxembourgers | 100.0 /100 | #34 | Exceptional 97.0% |
| Alaska Natives | 100.0 /100 | #35 | Exceptional 97.0% |
| Belgians | 100.0 /100 | #36 | Exceptional 97.0% |