South American Indian vs Colville High School Diploma
COMPARE
South American Indian
Colville
High School Diploma
High School Diploma Comparison
South American Indians
Colville
88.5%
HIGH SCHOOL DIPLOMA
12.2/ 100
METRIC RATING
212th/ 347
METRIC RANK
88.3%
HIGH SCHOOL DIPLOMA
7.8/ 100
METRIC RATING
222nd/ 347
METRIC RANK
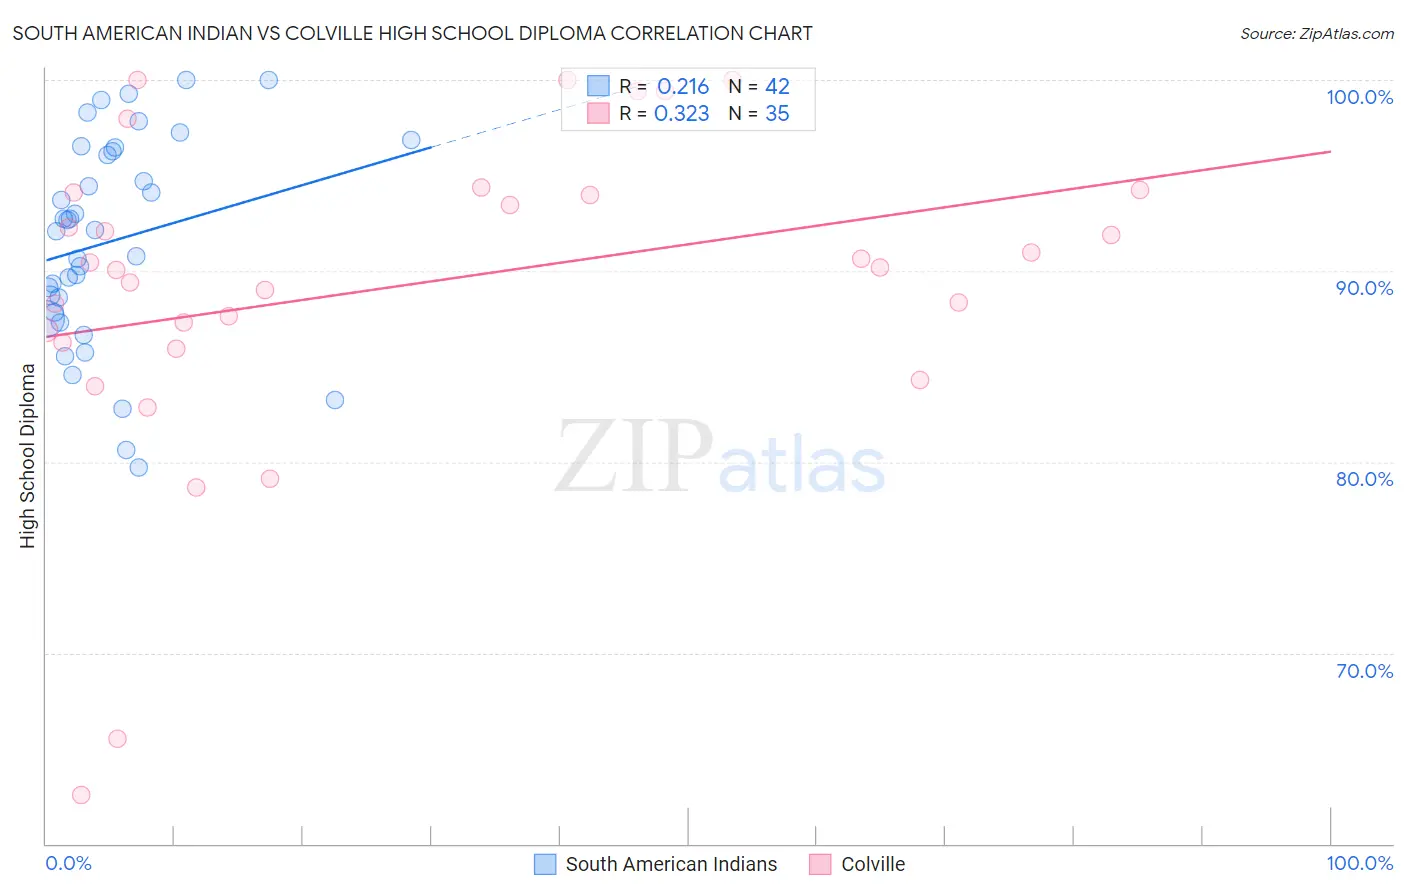
South American Indian vs Colville High School Diploma Correlation Chart
The statistical analysis conducted on geographies consisting of 164,573,088 people shows a weak positive correlation between the proportion of South American Indians and percentage of population with at least high school diploma education in the United States with a correlation coefficient (R) of 0.216 and weighted average of 88.5%. Similarly, the statistical analysis conducted on geographies consisting of 34,687,943 people shows a mild positive correlation between the proportion of Colville and percentage of population with at least high school diploma education in the United States with a correlation coefficient (R) of 0.323 and weighted average of 88.3%, a difference of 0.19%.
High School Diploma Correlation Summary
| Measurement | South American Indian | Colville |
| Minimum | 79.7% | 62.5% |
| Maximum | 100.0% | 100.0% |
| Range | 20.3% | 37.5% |
| Mean | 91.5% | 89.2% |
| Median | 92.1% | 90.2% |
| Interquartile 25% (IQ1) | 87.8% | 86.3% |
| Interquartile 75% (IQ3) | 96.3% | 94.1% |
| Interquartile Range (IQR) | 8.5% | 7.9% |
| Standard Deviation (Sample) | 5.3% | 8.4% |
| Standard Deviation (Population) | 5.3% | 8.3% |
Demographics Similar to South American Indians and Colville by High School Diploma
In terms of high school diploma, the demographic groups most similar to South American Indians are Inupiat (88.5%, a difference of 0.030%), Immigrants from Somalia (88.4%, a difference of 0.040%), Immigrants from Cameroon (88.4%, a difference of 0.050%), Crow (88.4%, a difference of 0.050%), and Samoan (88.5%, a difference of 0.060%). Similarly, the demographic groups most similar to Colville are Immigrants from Zaire (88.3%, a difference of 0.010%), Immigrants from Afghanistan (88.3%, a difference of 0.040%), Shoshone (88.3%, a difference of 0.040%), Creek (88.3%, a difference of 0.050%), and Tongan (88.4%, a difference of 0.080%).
| Demographics | Rating | Rank | High School Diploma |
| Immigrants | Sierra Leone | 15.8 /100 | #207 | Poor 88.6% |
| Portuguese | 14.4 /100 | #208 | Poor 88.5% |
| Cherokee | 14.3 /100 | #209 | Poor 88.5% |
| Samoans | 14.0 /100 | #210 | Poor 88.5% |
| Inupiat | 13.1 /100 | #211 | Poor 88.5% |
| South American Indians | 12.2 /100 | #212 | Poor 88.5% |
| Immigrants | Somalia | 11.3 /100 | #213 | Poor 88.4% |
| Immigrants | Cameroon | 10.9 /100 | #214 | Poor 88.4% |
| Crow | 10.9 /100 | #215 | Poor 88.4% |
| Chickasaw | 10.7 /100 | #216 | Poor 88.4% |
| Immigrants | Africa | 10.6 /100 | #217 | Poor 88.4% |
| Immigrants | Bolivia | 10.3 /100 | #218 | Poor 88.4% |
| Costa Ricans | 9.6 /100 | #219 | Tragic 88.4% |
| Tongans | 9.5 /100 | #220 | Tragic 88.4% |
| Immigrants | Afghanistan | 8.6 /100 | #221 | Tragic 88.3% |
| Colville | 7.8 /100 | #222 | Tragic 88.3% |
| Immigrants | Zaire | 7.6 /100 | #223 | Tragic 88.3% |
| Shoshone | 7.0 /100 | #224 | Tragic 88.3% |
| Creek | 6.9 /100 | #225 | Tragic 88.3% |
| Uruguayans | 5.6 /100 | #226 | Tragic 88.2% |
| Immigrants | Liberia | 5.5 /100 | #227 | Tragic 88.2% |