Immigrants from Israel vs Slovak 10th Grade
COMPARE
Immigrants from Israel
Slovak
10th Grade
10th Grade Comparison
Immigrants from Israel
Slovaks
94.4%
10TH GRADE
95.4/ 100
METRIC RATING
119th/ 347
METRIC RANK
96.0%
10TH GRADE
100.0/ 100
METRIC RATING
2nd/ 347
METRIC RANK
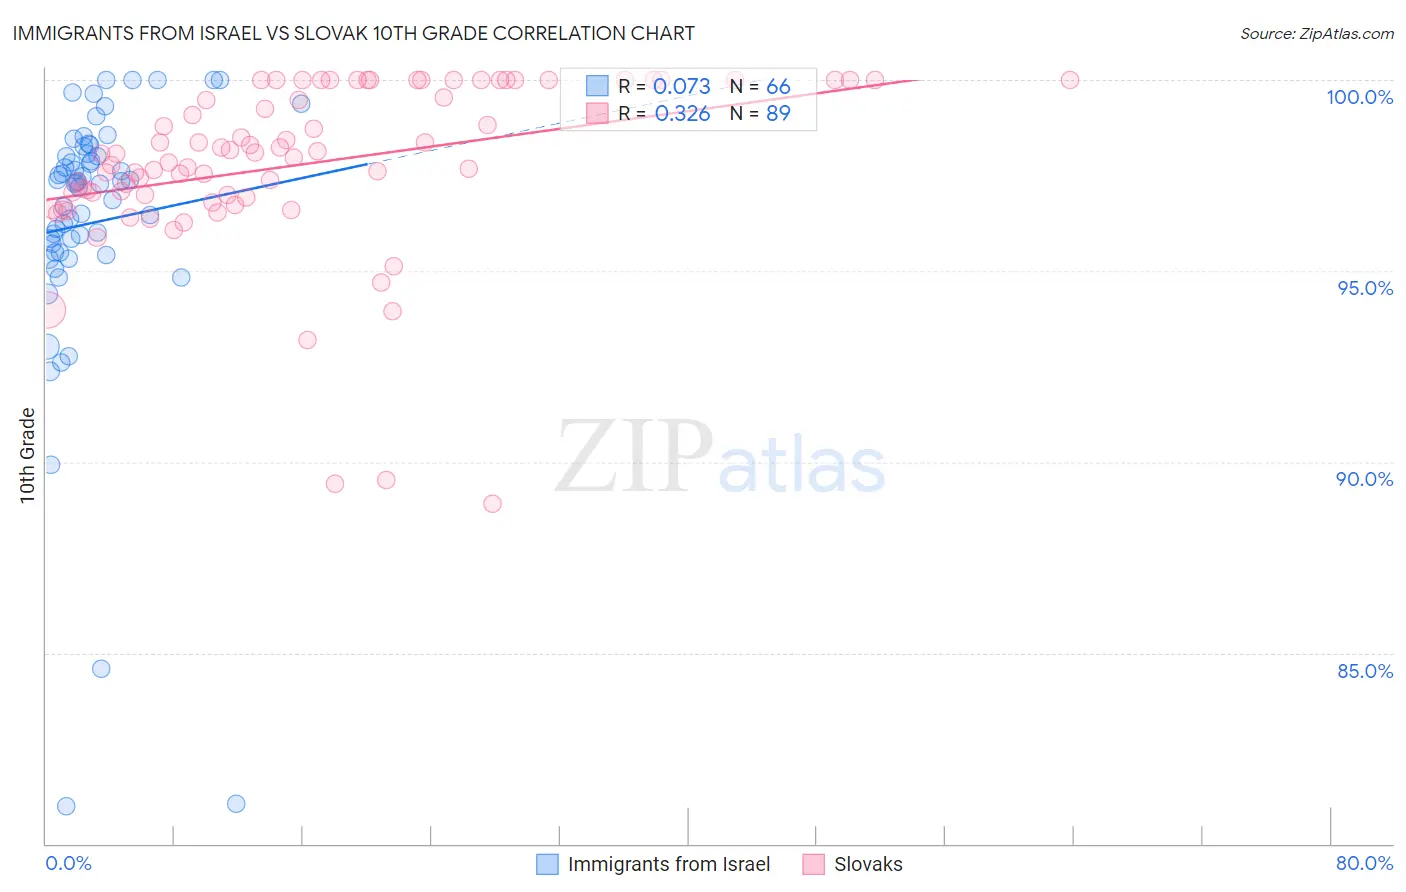
Immigrants from Israel vs Slovak 10th Grade Correlation Chart
The statistical analysis conducted on geographies consisting of 210,030,386 people shows a slight positive correlation between the proportion of Immigrants from Israel and percentage of population with at least 10th grade education in the United States with a correlation coefficient (R) of 0.073 and weighted average of 94.4%. Similarly, the statistical analysis conducted on geographies consisting of 397,891,887 people shows a mild positive correlation between the proportion of Slovaks and percentage of population with at least 10th grade education in the United States with a correlation coefficient (R) of 0.326 and weighted average of 96.0%, a difference of 1.8%.
10th Grade Correlation Summary
| Measurement | Immigrants from Israel | Slovak |
| Minimum | 81.0% | 88.9% |
| Maximum | 100.0% | 100.0% |
| Range | 19.0% | 11.1% |
| Mean | 96.3% | 97.8% |
| Median | 97.3% | 98.1% |
| Interquartile 25% (IQ1) | 95.5% | 97.0% |
| Interquartile 75% (IQ3) | 98.1% | 100.0% |
| Interquartile Range (IQR) | 2.6% | 3.0% |
| Standard Deviation (Sample) | 3.7% | 2.3% |
| Standard Deviation (Population) | 3.7% | 2.2% |
Similar Demographics by 10th Grade
Demographics Similar to Immigrants from Israel by 10th Grade
In terms of 10th grade, the demographic groups most similar to Immigrants from Israel are Jordanian (94.4%, a difference of 0.010%), Immigrants from Taiwan (94.4%, a difference of 0.010%), Immigrants from Belarus (94.4%, a difference of 0.010%), Inupiat (94.4%, a difference of 0.010%), and Immigrants from Hungary (94.4%, a difference of 0.020%).
| Demographics | Rating | Rank | 10th Grade |
| Immigrants | Kuwait | 96.8 /100 | #112 | Exceptional 94.4% |
| Palestinians | 96.5 /100 | #113 | Exceptional 94.4% |
| German Russians | 96.3 /100 | #114 | Exceptional 94.4% |
| Delaware | 96.3 /100 | #115 | Exceptional 94.4% |
| Sioux | 96.2 /100 | #116 | Exceptional 94.4% |
| Immigrants | Hungary | 95.8 /100 | #117 | Exceptional 94.4% |
| Jordanians | 95.6 /100 | #118 | Exceptional 94.4% |
| Immigrants | Israel | 95.4 /100 | #119 | Exceptional 94.4% |
| Immigrants | Taiwan | 95.3 /100 | #120 | Exceptional 94.4% |
| Immigrants | Belarus | 95.2 /100 | #121 | Exceptional 94.4% |
| Inupiat | 95.1 /100 | #122 | Exceptional 94.4% |
| Cree | 95.1 /100 | #123 | Exceptional 94.4% |
| Basques | 94.9 /100 | #124 | Exceptional 94.3% |
| Americans | 94.4 /100 | #125 | Exceptional 94.3% |
| Immigrants | Iran | 94.4 /100 | #126 | Exceptional 94.3% |
Demographics Similar to Slovaks by 10th Grade
In terms of 10th grade, the demographic groups most similar to Slovaks are Slovene (95.9%, a difference of 0.10%), Swedish (95.9%, a difference of 0.10%), Carpatho Rusyn (95.9%, a difference of 0.12%), Norwegian (96.2%, a difference of 0.13%), and Polish (95.8%, a difference of 0.23%).
| Demographics | Rating | Rank | 10th Grade |
| Norwegians | 100.0 /100 | #1 | Exceptional 96.2% |
| Slovaks | 100.0 /100 | #2 | Exceptional 96.0% |
| Slovenes | 100.0 /100 | #3 | Exceptional 95.9% |
| Swedes | 100.0 /100 | #4 | Exceptional 95.9% |
| Carpatho Rusyns | 100.0 /100 | #5 | Exceptional 95.9% |
| Poles | 100.0 /100 | #6 | Exceptional 95.8% |
| Germans | 100.0 /100 | #7 | Exceptional 95.8% |
| Lithuanians | 100.0 /100 | #8 | Exceptional 95.8% |
| Finns | 100.0 /100 | #9 | Exceptional 95.8% |
| Croatians | 100.0 /100 | #10 | Exceptional 95.7% |
| Danes | 100.0 /100 | #11 | Exceptional 95.7% |
| Tlingit-Haida | 100.0 /100 | #12 | Exceptional 95.7% |
| English | 100.0 /100 | #13 | Exceptional 95.6% |
| Tsimshian | 100.0 /100 | #14 | Exceptional 95.6% |
| Irish | 100.0 /100 | #15 | Exceptional 95.6% |