South African vs Immigrants from Brazil 10th Grade
COMPARE
South African
Immigrants from Brazil
10th Grade
10th Grade Comparison
South Africans
Immigrants from Brazil
94.7%
10TH GRADE
98.8/ 100
METRIC RATING
90th/ 347
METRIC RANK
94.0%
10TH GRADE
75.5/ 100
METRIC RATING
153rd/ 347
METRIC RANK
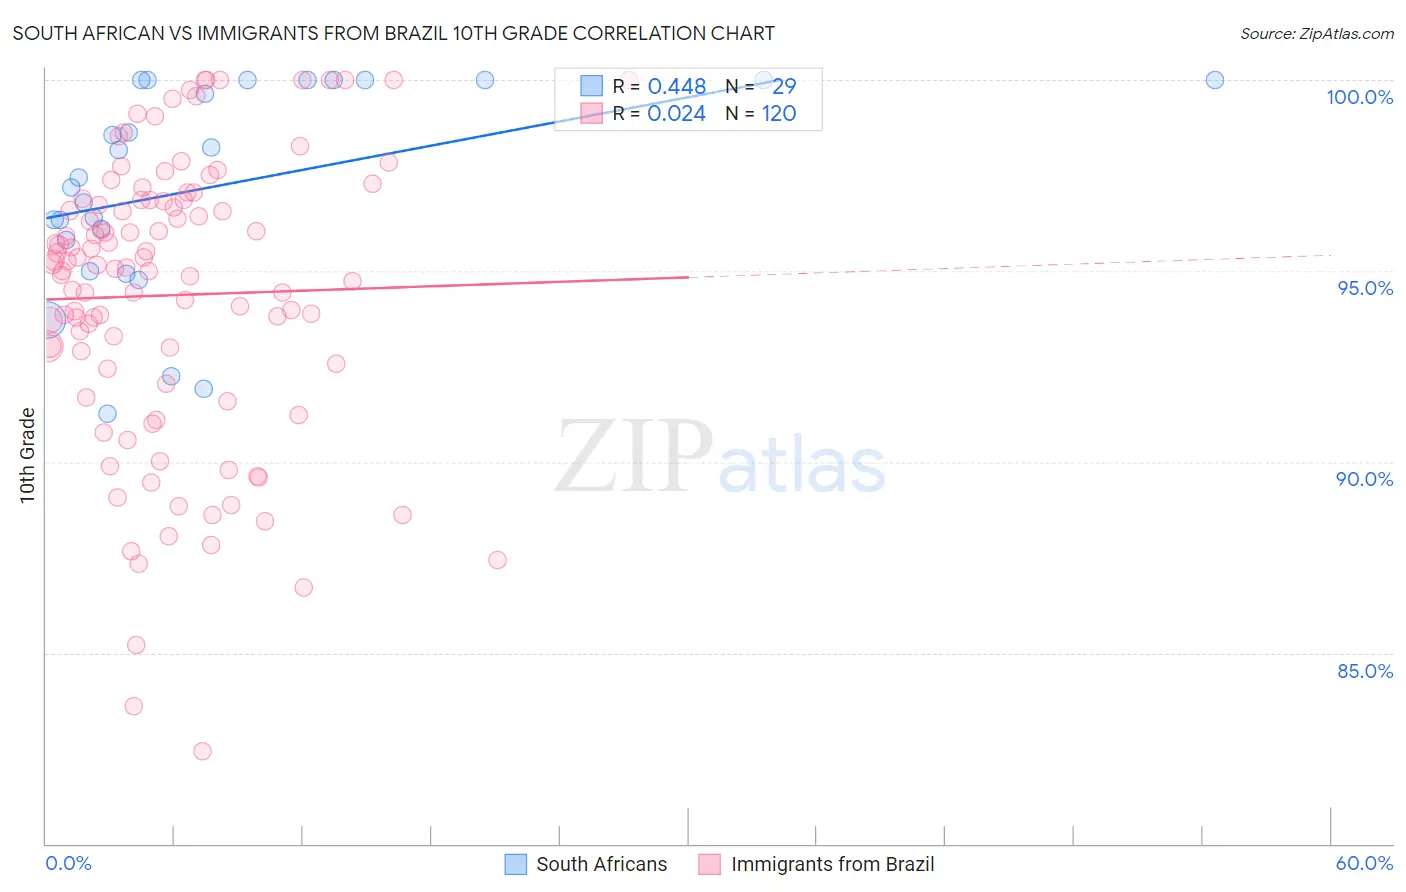
South African vs Immigrants from Brazil 10th Grade Correlation Chart
The statistical analysis conducted on geographies consisting of 182,604,532 people shows a moderate positive correlation between the proportion of South Africans and percentage of population with at least 10th grade education in the United States with a correlation coefficient (R) of 0.448 and weighted average of 94.7%. Similarly, the statistical analysis conducted on geographies consisting of 342,965,001 people shows no correlation between the proportion of Immigrants from Brazil and percentage of population with at least 10th grade education in the United States with a correlation coefficient (R) of 0.024 and weighted average of 94.0%, a difference of 0.74%.
10th Grade Correlation Summary
| Measurement | South African | Immigrants from Brazil |
| Minimum | 91.3% | 82.4% |
| Maximum | 100.0% | 100.0% |
| Range | 8.7% | 17.6% |
| Mean | 97.2% | 94.4% |
| Median | 97.5% | 95.1% |
| Interquartile 25% (IQ1) | 95.4% | 92.5% |
| Interquartile 75% (IQ3) | 100.0% | 96.8% |
| Interquartile Range (IQR) | 4.6% | 4.3% |
| Standard Deviation (Sample) | 2.7% | 3.8% |
| Standard Deviation (Population) | 2.6% | 3.8% |
Similar Demographics by 10th Grade
Demographics Similar to South Africans by 10th Grade
In terms of 10th grade, the demographic groups most similar to South Africans are Immigrants from Moldova (94.7%, a difference of 0.010%), White/Caucasian (94.7%, a difference of 0.010%), Immigrants from Japan (94.7%, a difference of 0.020%), Immigrants from Saudi Arabia (94.7%, a difference of 0.030%), and Crow (94.7%, a difference of 0.040%).
| Demographics | Rating | Rank | 10th Grade |
| Immigrants | Western Europe | 99.1 /100 | #83 | Exceptional 94.7% |
| Icelanders | 99.1 /100 | #84 | Exceptional 94.7% |
| Crow | 99.0 /100 | #85 | Exceptional 94.7% |
| Puget Sound Salish | 99.0 /100 | #86 | Exceptional 94.7% |
| Immigrants | Saudi Arabia | 99.0 /100 | #87 | Exceptional 94.7% |
| Immigrants | Japan | 99.0 /100 | #88 | Exceptional 94.7% |
| Immigrants | Moldova | 98.9 /100 | #89 | Exceptional 94.7% |
| South Africans | 98.8 /100 | #90 | Exceptional 94.7% |
| Whites/Caucasians | 98.8 /100 | #91 | Exceptional 94.7% |
| Yugoslavians | 98.4 /100 | #92 | Exceptional 94.6% |
| Soviet Union | 98.3 /100 | #93 | Exceptional 94.6% |
| Immigrants | Germany | 98.3 /100 | #94 | Exceptional 94.6% |
| Menominee | 98.3 /100 | #95 | Exceptional 94.6% |
| Immigrants | Switzerland | 98.3 /100 | #96 | Exceptional 94.6% |
| Lebanese | 98.3 /100 | #97 | Exceptional 94.6% |
Demographics Similar to Immigrants from Brazil by 10th Grade
In terms of 10th grade, the demographic groups most similar to Immigrants from Brazil are Immigrants from Kenya (94.0%, a difference of 0.0%), Spanish (94.0%, a difference of 0.010%), Mongolian (94.0%, a difference of 0.010%), Immigrants from Italy (94.0%, a difference of 0.030%), and Kiowa (93.9%, a difference of 0.030%).
| Demographics | Rating | Rank | 10th Grade |
| Chickasaw | 82.6 /100 | #146 | Excellent 94.1% |
| Immigrants | Ukraine | 81.5 /100 | #147 | Excellent 94.0% |
| Arabs | 80.9 /100 | #148 | Excellent 94.0% |
| Ugandans | 80.7 /100 | #149 | Excellent 94.0% |
| Egyptians | 79.6 /100 | #150 | Good 94.0% |
| Kenyans | 79.1 /100 | #151 | Good 94.0% |
| Immigrants | Italy | 78.0 /100 | #152 | Good 94.0% |
| Immigrants | Brazil | 75.5 /100 | #153 | Good 94.0% |
| Immigrants | Kenya | 75.3 /100 | #154 | Good 94.0% |
| Spanish | 74.9 /100 | #155 | Good 94.0% |
| Mongolians | 74.4 /100 | #156 | Good 94.0% |
| Kiowa | 73.3 /100 | #157 | Good 93.9% |
| Bermudans | 71.0 /100 | #158 | Good 93.9% |
| Chileans | 70.2 /100 | #159 | Good 93.9% |
| Pakistanis | 70.1 /100 | #160 | Good 93.9% |